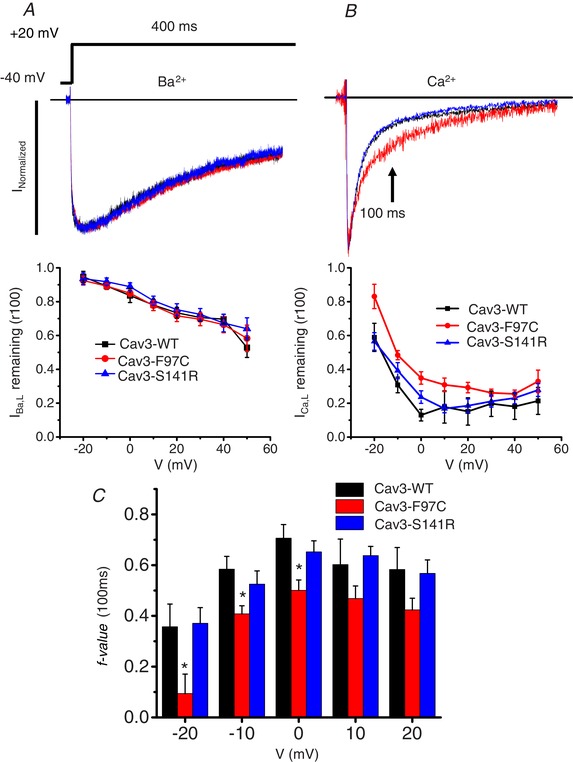
Figure 4.

Cav3‐F97C slows Ca2+‐dependent inactivation of Cav1.2 channels
A, representative I Ba,L traces resulting from test pulses at 20 mV from HEK293 cells transfected with Cav1.2 + Cavβ2cN4 and Cav3‐WT (n = 7), Cav3‐F97C (n = 9) or Cav3‐S141R (n = 7). Current decay of I Ba,L was determined by measuring the ratio of the current present after 100 ms of a voltage step relative to the peak current (r100). B, representative I Ca,L traces resulting from test pulses at 20 mV from HEK293 cells transfected with Cav1.2 + Cavβ2cN4 and Cav3‐WT (n = 3), Cav3‐F97C (n = 5) or Cav3‐S141R (n = 5). Current decay of I Ca,L was determined by measuring the ratio of the current present after 100 ms of a voltage step relative to the peak current (r100). C, the f value is plotted as an index of Ca2+‐dependent inactivation by eliminating the effect of VDI at test potentials from −20 to 20 mV, between Cav3‐WT (n = 3–7), Cav3‐F97C (n = 5–9) and Cav3‐S141R (n = 5–7), as described in the Methods.
