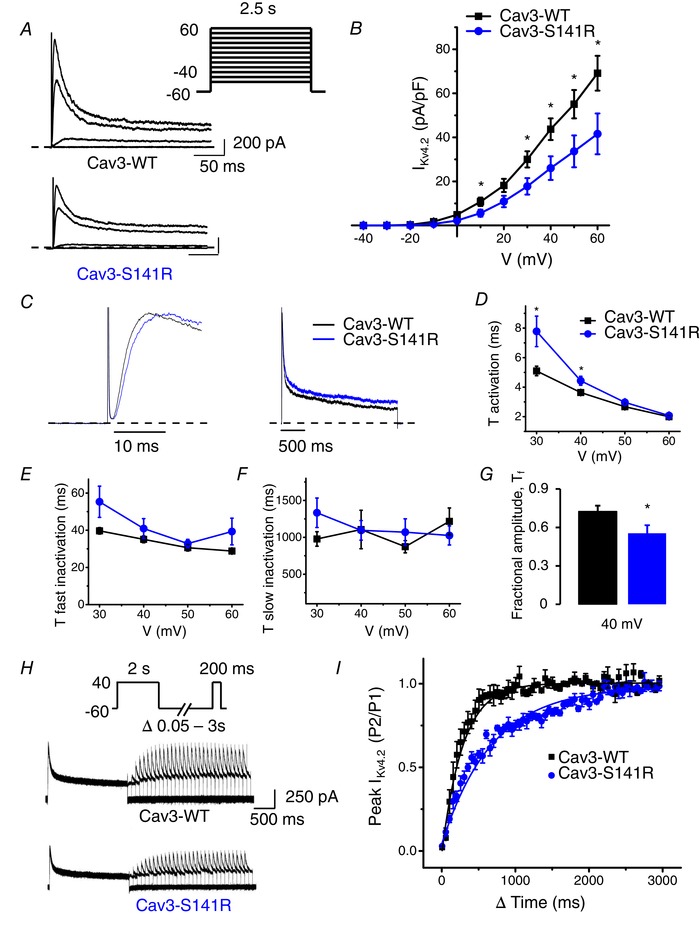
Figure 7.

Cav3‐S141R coexpression decreases Kv4.2 current density, alters current kinetics and slows recovery from inactivation
A, representative current traces illustrating Kv4.2 currents measured at −40, 0, 40 and 60 mV in HEK293 cells transfected with Kv4.2 and Cav3‐WT or Cav3‐S141R. Whole‐cell currents were recorded using the protocol indicated in the inset. B, mean I–V relationships of peak Kv4.2 current density in HEK293 cells transfected with Kv4.2 and Cav3‐WT or Cav3‐S141R (mean ± SEM, n = 11 or 12 cells, *P < 0.05). C, representative I Kv4.2 traces normalized by peak transfected with Cav3‐WT and Cav3‐S141R measured at 40 mV showing the kinetic changes. D, average τ activation for I Kv4.2 from Cav3‐WT and Cav3‐ S141R expressing cells as a function of test voltage (mean ± SEM, n = 11 cells, *P < 0.05). τ activation determined by fitting a single exponential function to the rising phase (activation) of I Kv4.2. E and F, average τfast inactivation and τslow inactivation for I Kv4.2 as determined by fitting a double exponential function to the decaying phase of I Kv4.2 traces (mean ± SEM, n = 11 cells, *P < 0.05). G, average fractional amplitude of fast inactivating (τfast) I Kv4.2 at 40 mV comparing Cav3‐WT and Cav3‐S141R expressing cells (mean ± SEM, n = 11 cells, *P < 0.05). H, representative I Kv4.2 traces demonstrating recovery from inactivation following a 2 s depolarization to 40 mV with co‐expression of Cav3‐WT or Cav3‐S141R. I, time course of recovery from inactivation for I Kv4.2 currents in Cav3‐WT and Cav3‐S141R expressing cells. Ratio between the current amplitude obtained with both pulses of the protocol is plotted against the interpulse interval. Recovery time constant for Cav3‐WT was 177.5 ± 24.5 ms (n = 5) compared to 518.9 ± 94.2 ms for Cav3‐S141R (n = 8; P < 0.05).
