
Figure 2.
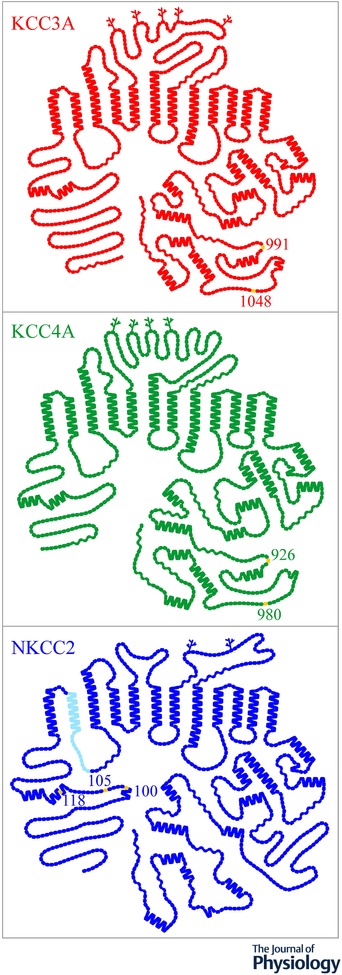
Topological models of NKCC1, KCC3 and KCC4
The models were generated with PLOT (Biff Forbush, Yale University). Each glycosylation site is illustrated through a branched line and each residue through a single symbol. Yellow is used to designate well‐characterized phosphoacceptor residues and light blue a protein segment that comes in three variants from alternative splicing of the primary transcript.