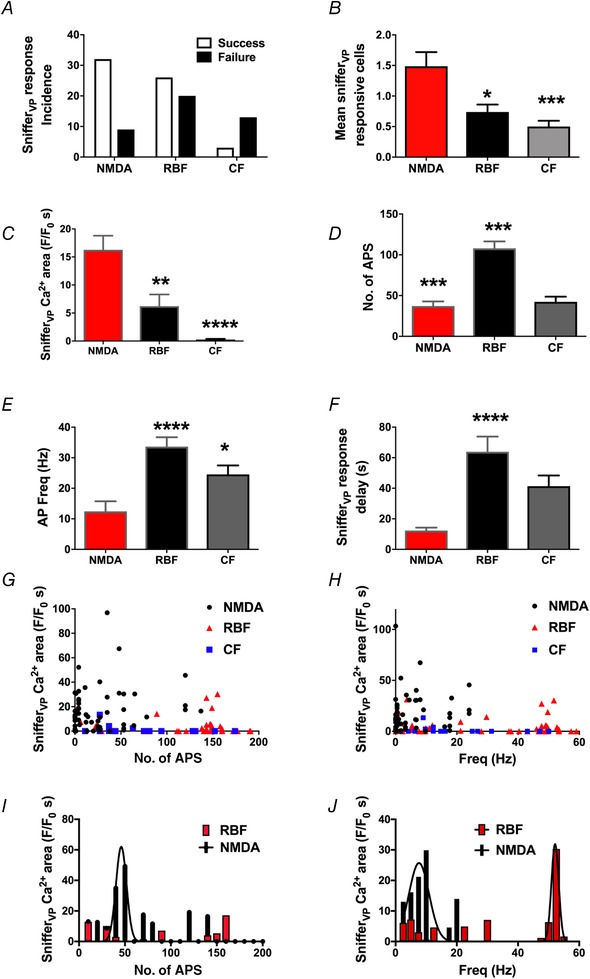
Figure 9.

Summary of relationship between somatodendritic release of VP and the number and frequency of action potentials evoked with the three different firing modalities
A, the incidence of successful somatodendritic release events was significantly higher in NMDAR‐evoked firing when compared to RBF or CF. B and C, summary of the mean number of snifferVP responsive cells (B) and snifferVP Ca2+ magnitude (area) (C) in response to the three stimulation modalities. D and E, summary of the mean number of action potentials (D) and mean firing frequency (E) evoked by the three stimulation modalities in patched eGFP–VP neurons. F, summary of the mean snifferVP Ca2+ response delay following stimulation of eGFP–VP neurones with the three different firing modalities. G and H, plots of snifferVP Ca2+ responses (area) as a function of the number of APs (G) or action potential frequency (H). Note the lack of correlations observed in the three different stimulation modalities (no. of APs: r 2 = 0.04, 0.04 and 0.07 for NMDA, RBF and CF, respectively; frequency: r 2 = 0.002, 0.009 and 0.05 for NMDA, RBF and CF, respectively). I, plot showing a running average of the mean snifferVP Ca2+ response as a function of the number of evoked APs (bin = 10 APs). The NMDAR‐evoked, but not the RBF modality, was fit with a Gaussian function (r 2 = 0.6). J, plot showing a running average of the mean snifferVP Ca2+ response as a function of the firing frequency (bin = 2.5 Hz). Both the NMDAR‐evoked and the RBF modalities were fit with a Gaussian function (r 2 = 0.7 and 0.8, respectively). Note that the apparent optimal frequency for dendritic release in the case NMDAR‐evoked firing was shifted towards lower firing frequencies compared to the RBF modality. * P < 0.05, ** P < 0.01, *** P < 0.001 and **** P < 0.0001 vs NMDA (B, C, E, F) or vs. RBF (D), one‐way ANOVA. For A, D and E: n (stimulated VP neurones) = 45, 46 and 30 for NMDA, RBF and CF, respectively. For B, n (individual snifferVP cells) = 67, 54 and 15 for NMDA, RBF and CF, respectively. For F, n (individual snifferVP cells with a positive response) = 47, 29 and 3 for NMDA, RBF and CF, respectively. [Color figure can be viewed at wileyonlinelibrary.com]
