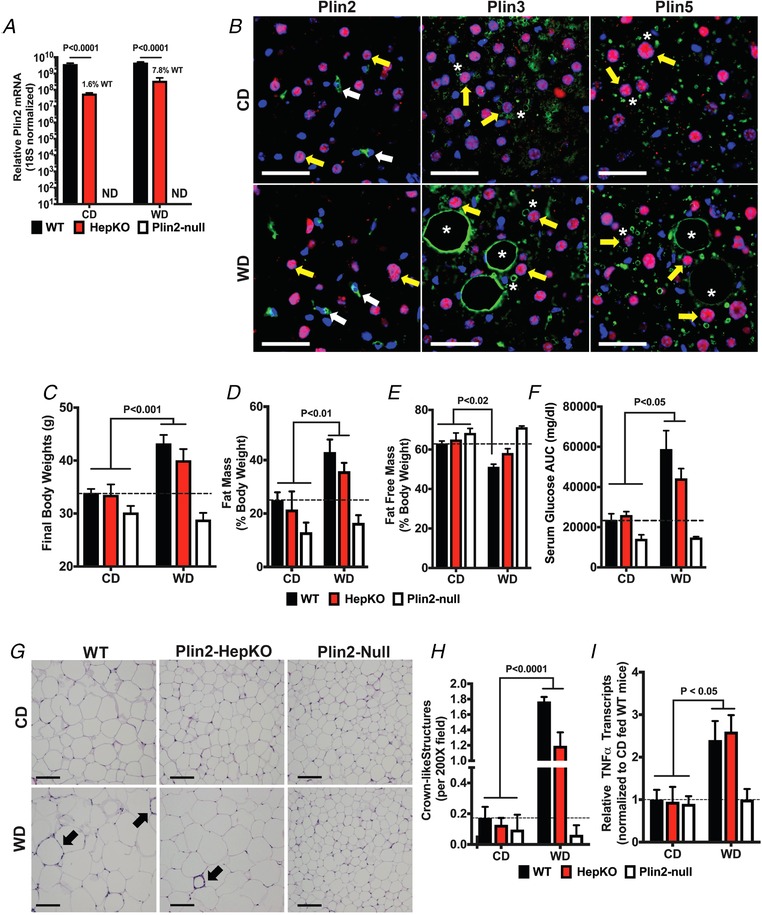
Figure 1.

Effects of WD feeding and Plin2 genotype on obesity, glucose clearance and adipose inflammation
A, relative Plin2 mRNA levels in livers of WT, Plin2‐HepKO and Plin2‐Null mice fed CD or WD for 30 weeks. Values are 18S RNA normalized means ± SEM (N = 4 mice per group). Plin2 was below detection levels (ND) in livers of Plin2‐Null mice. Note use of log scale for the y‐axis. B, representative liver sections from Plin2‐HepKO mice fed CD or WD for 30 weeks and immunostained for Plin2, Plin3 or Plin5 (green) and hepatocyte nuclear factor‐4 as marker of hepatocyte nuclei (red). Nuclei were stained with DAPI (blue). Plin2 staining (left panels) was exclusively detected on small CLDs found in sinusoidally localized hepatic stellate cells (white arrows) in both CD‐ and WD‐fed mice. Plin3 (middle panels) and Plin5 (right panels) were detected on small and large macrovesicular CLDs (asterisks) in hepatocytes (yellow arrows) of CD‐ and WD‐fed mice. Scale bars, 50 μM. C–F, final body weights (C), fat mass (D) and fat free mass (E) values as percentages of body weight, and serum glucose area under the curve values (F) for WT, Plin2‐HepKO and Plin2‐Null mice fed CD or WD for 30 weeks. G, representative images of Hematoxylin and Eosin (H&E)‐stained epididymal adipose tissue (eWAT) sections from WT, Plin2‐HepKO or Plin2‐Null mice fed CD or WD for 30 weeks. Arrows indicate the crown‐like structures (CLS). Scale bars, 100 μm. Relative increases in CLS (H) and TNFα transcript (I) in eWAT of mice fed the WD for 30 weeks. For panels C–F, and H and I, values are means ± SEM (N = 3–6 mice per group). Values of WD‐fed mice that were statistically different from CD‐fed animals are indicated by brackets. The corresponding P values refer to the minimal statistical significance between the indicated WD‐ and CD‐fed mice. The dashed horizontal lines indicate values for CD‐fed WT mice.
