
Figure 1.
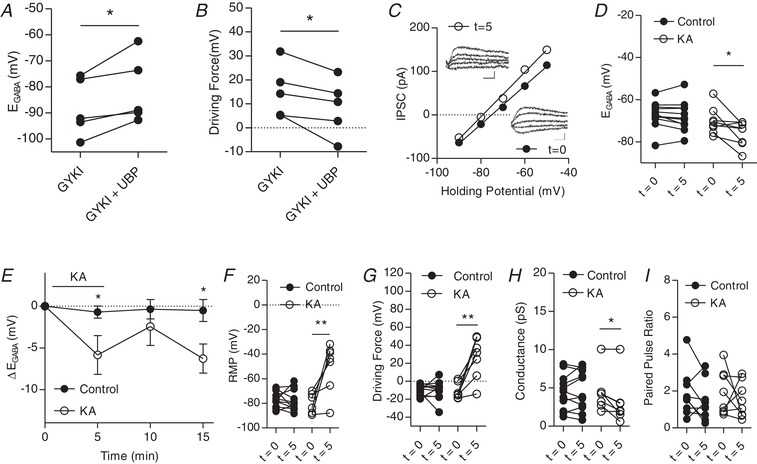
Kainate receptors modulate IPSCs in CA3 pyramidal cells
A, group data showing E GABA before and after KAR blockade with UBP310 (n = 5). B, group data showing driving force for Cl– before and after KAR blockade with UBP310 (n = 5). C, plot of voltage–current curve for a cell at t = 0 (E GABA = −75.1 mV) and t = 5(E GABA = −79.1 mV). Inset: examples of evoked IPSCs (scale bar = 60 pA, 10 ms). D, group data showing E GABA at t = 0 and t = 5 (n = 11 control, 8 KA). E, plot of group data showing the effect of 1 μm KA application on E GABA over time (n = 11 control, 8 KA) F, group data showing resting membrane potential at t = 0 and t = 5 (n = 11 control, 8 KA). G, group data showing driving force for Cl– at t = 0 and t = 5 (n = 11 control, 8 KA). H, group data showing C– conductance at t = 0 and t = 5 (n = 11 control, 8 KA). I, group data showing paired pulse ratio at t = 0 and t = 5 (n = 9 control, 8 KA) (* P < 0.05, ** P < 0.01).