
Figure 4.
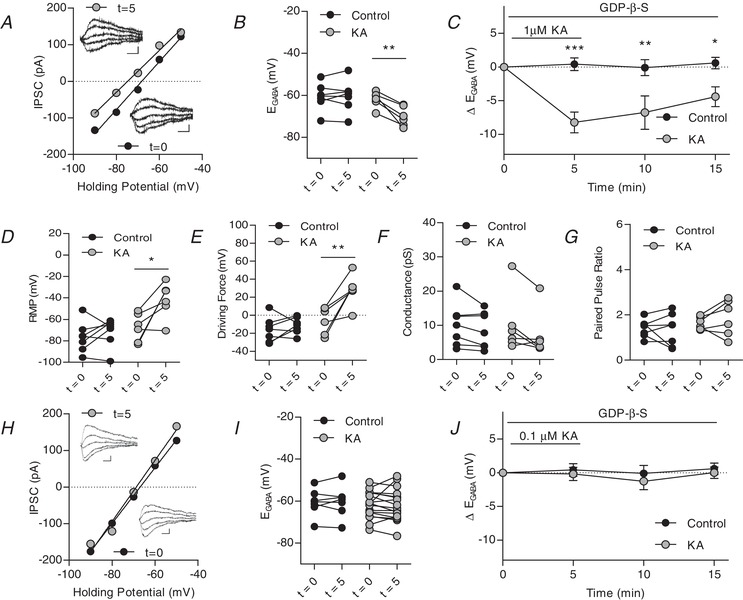
Kainate receptors activated by 1 μM kainic acid modulate IPSCs in the presence of metabotropic signalling blocker GDP‐β‐S
A, plot of voltage–current curve for a cell at t = 0 (E GABA = −68.6 mV) and t = 5 (E GABA = −74.2 mV). Inset, examples of evoked IPSCs (scale bar: 60 pA, 10 ms). B, group data showing E GABA at t = 0 and t = 5. C, plot of group data showing the effect of 1 μM KA on E GABA over time. D, group data showing resting membrane potential at t = 0 and t = 5. with 1 μM KA application E, group data showing driving force for Cl− at t = 0 and t = 5 (n = 13 control, n = 6 KA). F, group data showing Cl− conductance at t = 0 and t = 5 with 1 μM KA application. G, group data showing paired pulse ratio at t = 0 and t = 5 with 1 μM KA application (n = 7 control, n = 6 KA, all 1 μM KA experiments). H, plot of voltage‐current curve for a cell at t = 0 (E GABA = −67.3 mV) and t = 15 (E GABA = −69.1 mV) with 0.1 μM KA application. Inset, examples of evoked IPSCs (scale bar: 60 pA, 10 ms). I, group data showing E GABA at t = 0 and t = 5 with 0.1 μM KA. J, plot of group data showing the effect of 0.1 μM KA on E GABA over time. (n = 7 control, n = 17 KA, all 0.1 μM KA, experiments) (* P < 0.05, ** P < 0.01, *** P < 0.001) [Correction made on 9 February 2019, after first online publication: Figure 4 was replaced with the current version].