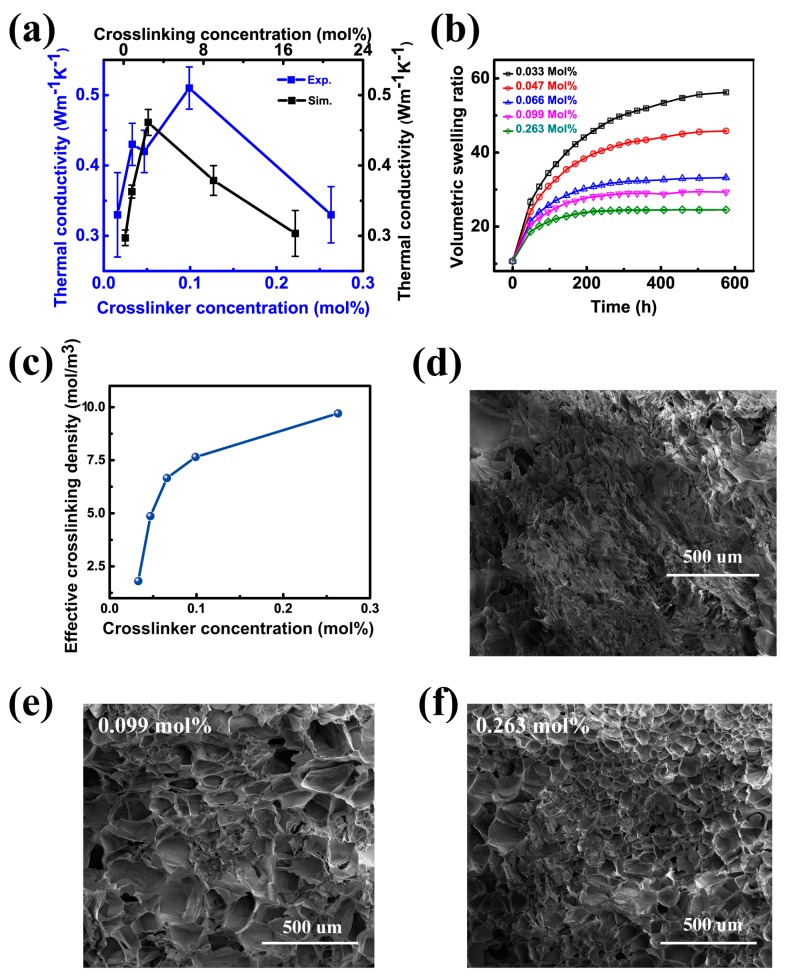
Figure 2.
Crosslinking effect of PAAm hydrogels. (a) Experimental and simulation results on the thermal conductivity of PAAm hydrogels with different crosslinker concentrations. The blue curves are the experimentally measured thermal conductivities by the 3ω method, and the black curves are the simulated thermal conductivities by molecular dynamics simulations; (b) The volumetric swelling ratio of PAAm hydrogels as a function of swelling time; (c) The relationship of the effective crosslinking density, and the corresponding crosslinker concentration. SEM images of PAAm gels of constant monomer concentrations and different stages of cross-linking; (d) 0.033 mol %; (e) 0.099 mol %; (f) 0.263 mol %.

