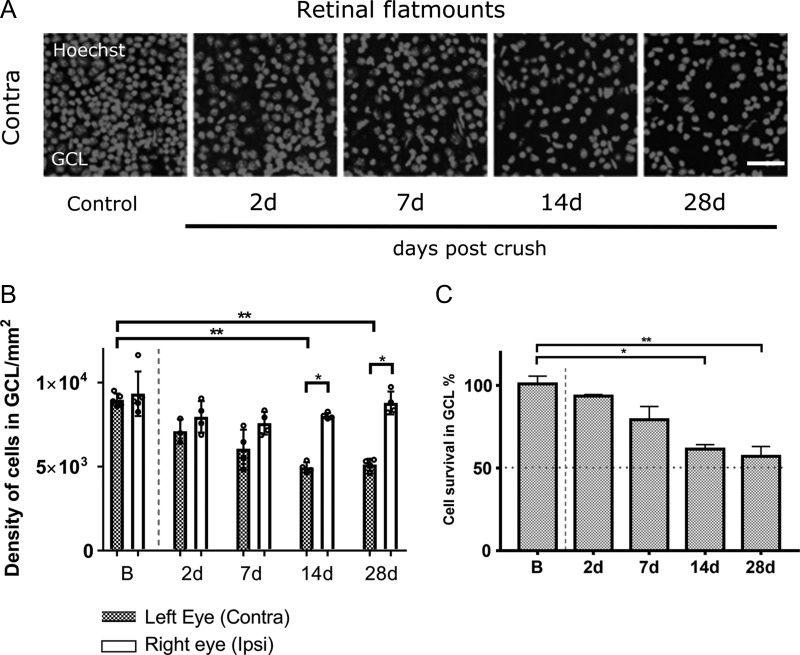
Figure 1.
Classification of cell loss in ganglion cell layer (GCL) of retina after unilateral ON crush. (A) Confocal images showing Hoechst stained cell nuclei in GCL of flat mounted retinal preparations from contralateral eyes after ON crush. Scale bar, 100 μm. (B) Density of Hoechst positive cells in GCL of contralateral and ipsilateral eyes. Bars represent median cell density and small circles are individual density values (contra B vs. contra 14 d; contra B vs. contra 28 d; **P < 0.01; Kruskal–Wallis test with Dunn’s post hoc test; contra 14 d vs. ipsi 14 d; contra 28 d vs. ipsi 28 d; *P < 0.05; Mann–Whitney test). (C) Quantification of surviving cells in GCL of retina, represented as percentage of surviving cells in GCL in the injured eye (contra), compared with the intact fellow eye (ipsi) (B vs. 14 d, *P < 0.05; B vs. 28 d; **P < 0.01; Kruskal–Wallis test with Dunn’s post hoc test). (B, C) B, 5 mice; 2 d, 3 mice; 7 d, 4 mice; 14 d, 4 mice; 28 d, 4 mice; Data are presented as medians and IQR.

