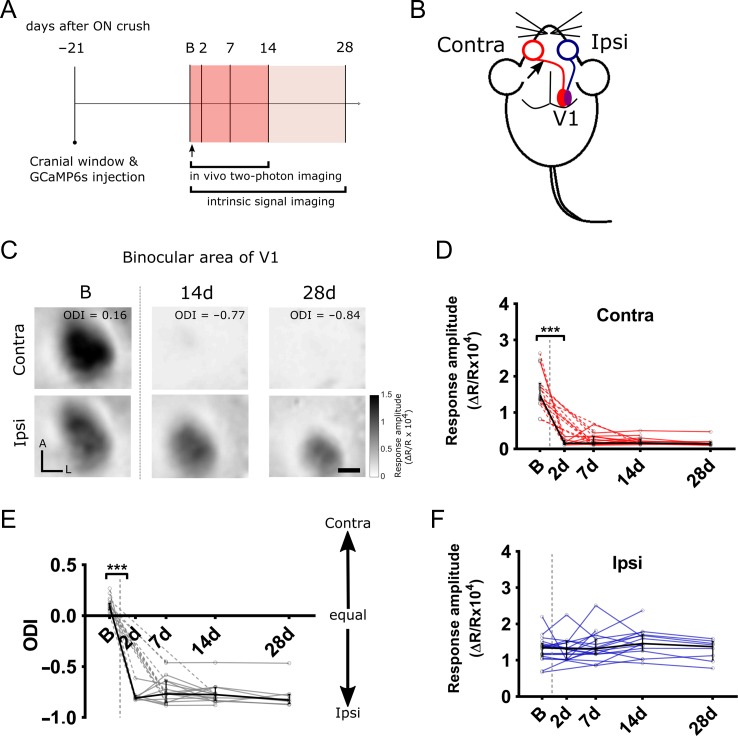
Figure 2.
Cortical V1b responses measured by intrinsic signal imaging after unilateral ON crush. (A) Experimental timeline to examine the cortical responses after unilateral ON crush. B—baseline (control) session, arrow indicates the time point of ON crush on contralateral eye. (B) Schematic representation of the experimental design. Arrow indicates ON crush site on contralateral side to the imaged V1 hemisphere. The binocular portion of V1 (V1b) is indicated by purple color. (C) Examples of intrinsic signal imaging (ISI) responses to the visual stimuli presentation to contralateral (top panel) and ipsilateral (bottom panel) eye in the binocular area of V1 of the same mouse. Panels show V1b responses to either eye obtained at baseline (left), 14 (middle) and 28 days (right) after unilateral ON crush was performed on the contralateral eye. A—anterior, L—lateral, ODI—ocular dominance index. Scale bar, 0.5 mm. (D, E) V1b responses to contralateral and ipsilateral eye stimulation. Red and blue lines are individual mouse response values. (Contra: B vs. all post crush time points, ***P < 0.001; Ipsi: B vs. postcrush time points, n.s.). (F) Ocular dominance index (ODI) values calculated from V1b responses to contralateral and ipsilateral eye after unilateral ON crush. gray lines are individual mouse ODI values (B vs. all post crush time points, ***P < 0.001). (D–F) Dashed lines connect missing values. Black line is a median and IQR, vertical gray dashed line is the time point of ON crush (B, 19 mice; 2 d, 8 mice; 7 d, 17 mice; 14 d, 15 mice; 28 d, 8 mice; Kruskal–Wallis test with Dunn’s post hoc test).

