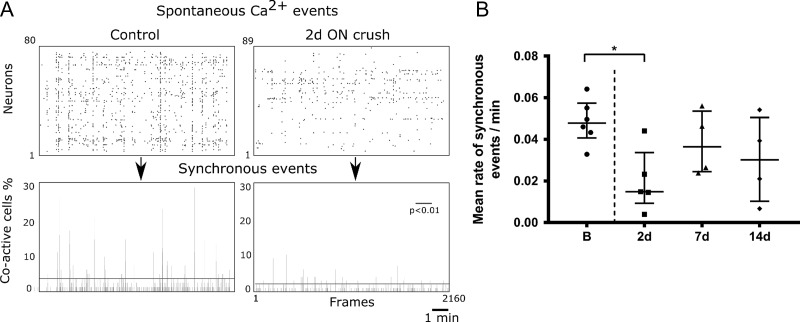
Figure 4.
Synchronous spontaneous activity in L2/3 of V1b after ON crush. (A) Examples of raster plots of detected spontaneous events (top panels) and sum of events per frame in single field of view (bottom panels) over 10 min of recording. Synchronous events are defined as the events above the horizontal line (bottom panels; P < 0.01; random permutation test). (B) Mean rate of synchronous events before and after ON crush. Synchronous events are expressed per neuron per minute (B vs. 2 d, P = 0.0294). Small circles are mean values of individual mice, error bars are medians and IQR (B, 6 mice; 2 d, 5 mice; 7 d, 4 mice; 14 d, 4 mice; Kruskal Wallis test with Dunn’s multiple test).

