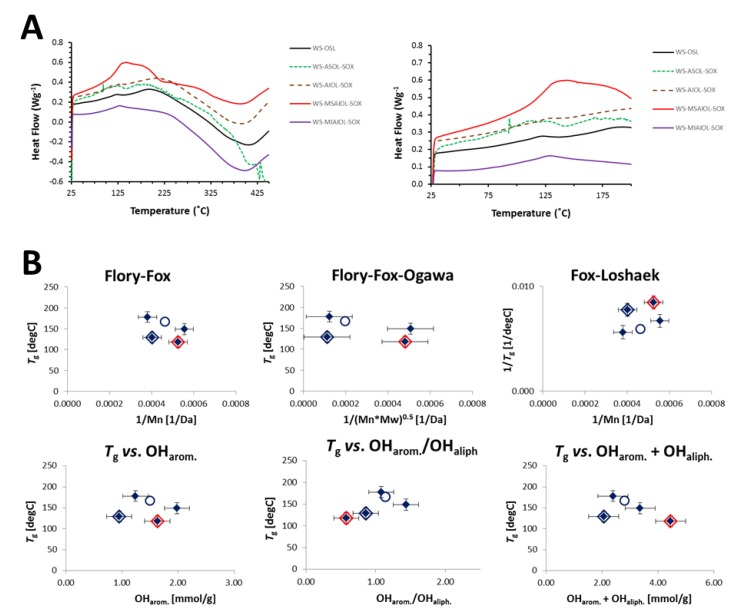
Figure 7.
(A) Heat flow curves obtained for WS-OSL and fractions derived thereof. (B) Correlation of glass transition temperatures with molecular weight characteristics according to Flory–Fox, Flory–Fox–Ogawa and Fox–Loshaek theories, respectively, as well as directly with the mean average molecular weight (Mn), the total amount of phenolic OH-groups and the ratio between aromatic and aliphatic OH-groups. WS-OSL is represented by the hollow circle, WS-MSAIOL-SOX is additionally evidenced by a red rhomb, and WS-MIAIOL-SOX by a blue rhomb.

