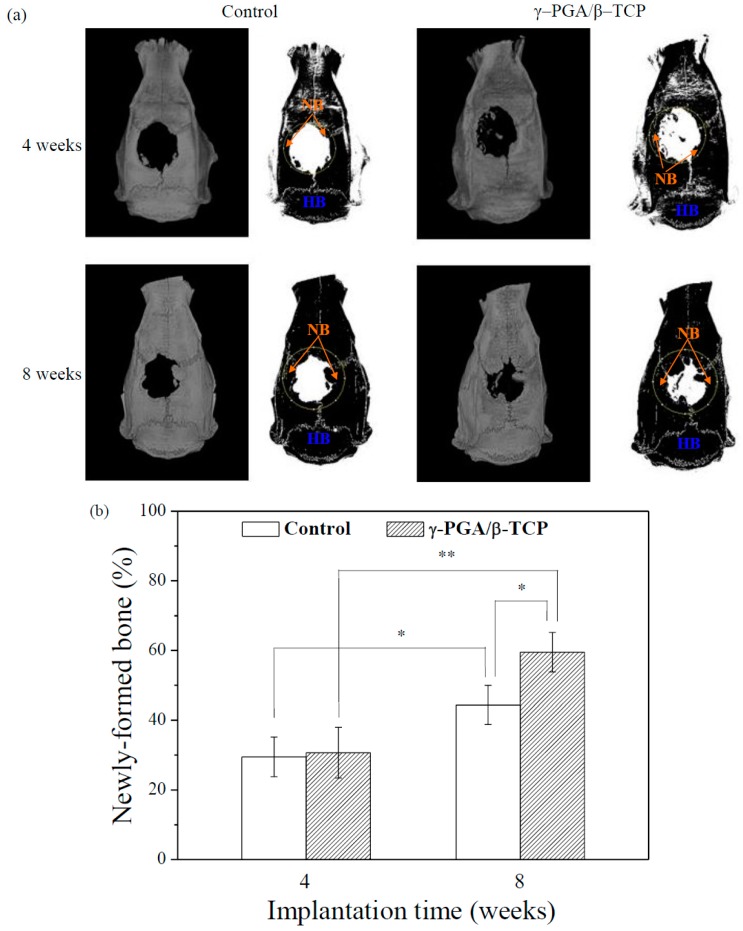
Figure 7.
(a) Micro-CT images of the rat calvarial bones covered with or without γ–PGA/β–TCP composite fibrous mats obtained 4 and 8 weeks postimplantation (HB = host bone, NB = new bone). The dotted circles indicate the original defects. (b) The quantitative micro-CT analysis of the newly formed bones in the rat calvaria defects (* p < 0.05 and ** p < 0.01).

