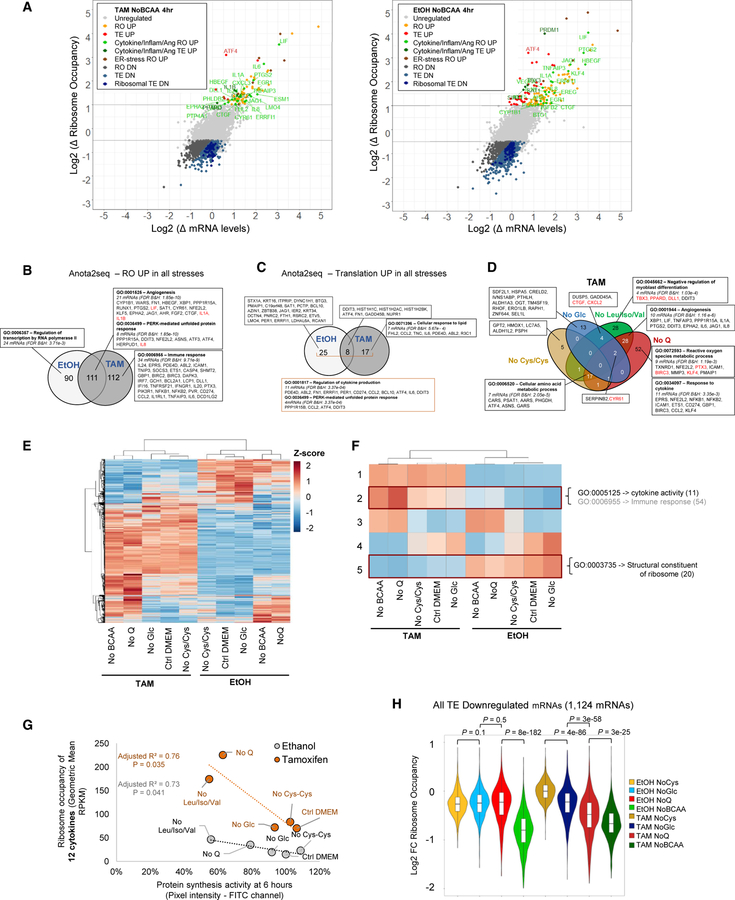
Figure 3. Regulation of mRNAs upon 4 hr of Metabolic Stress Conditions.
(A) Changes in mRNA and ribosome occupancy levels upon 4-hr deprivation of BCAAs relative to complete medium in transformed (left) and non-transformed (right) cells. Ang, angiogenesis; DN, down-regulated; RO, ribosome occupancy; UP, up-regulated.
(B and C) Venn diagram showing the anota2seq analysis of mRNAs with increased (B) transcriptional and (C) translational activity in all metabolic stresses in transformed versus non-transformed cells.
(D) Venn diagram showing the mRNAs with increased ribosome occupancy in each metabolic stress condition in transformed cells; cytokines are highlighted in red in non-inflammatory GO terms.
(E and F) Shown here: (E) hierarchical and (F) k-means clustering of ribosome occupancy across metabolic conditions.
(G) Correlation between protein synthesis and ribosome occupancy of regulated cytokines among nutrient-deprived conditions.
(H) Ribosome occupancy of all TE-downregulated mRNAs in each metabolic condition; p values are derived from the Wilcoxon test.
See also Figures S2 and S3.

