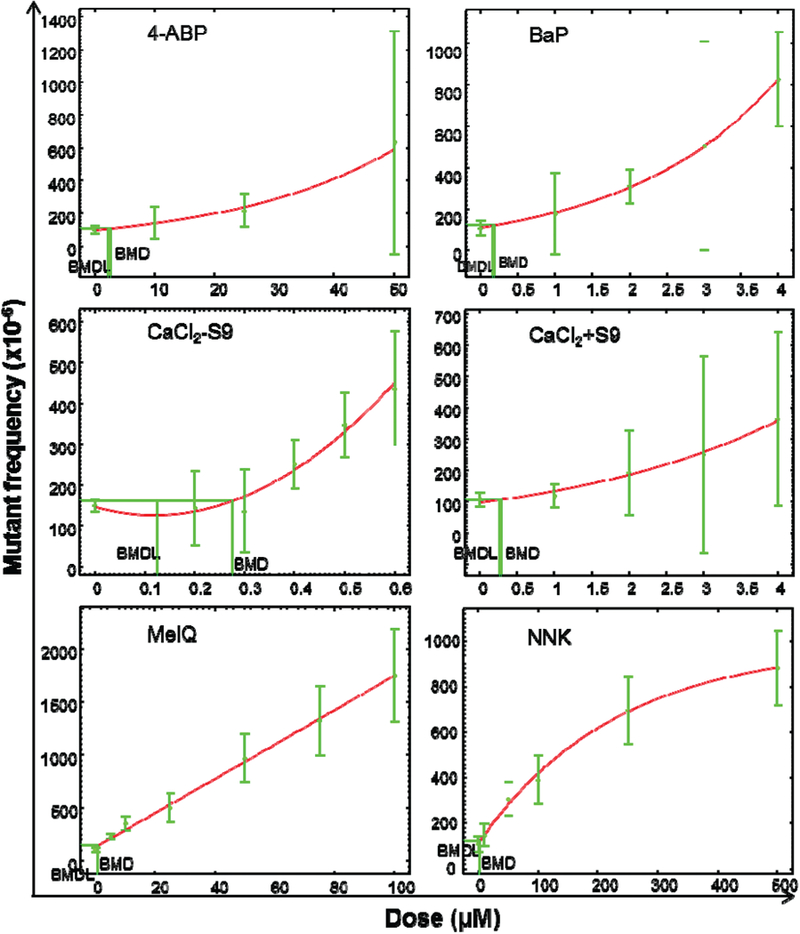
Figure 2.

Quantitative analysis of the dose-response induced by five chemicals in the mouse lymphoma cells. BMD10 and BMDL10, calculated by EPA’s BMDS software, are shown in each graph. The data points represent the mean mutant frequencies (MF) from Figure 1 and the bars represent the calculated 95% confidence interval of each MF
