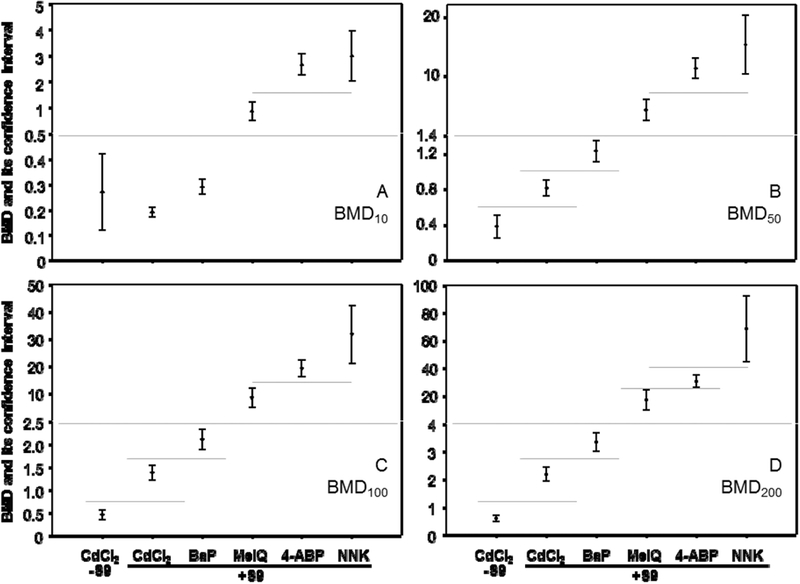
Figure 3.

Comparison of BMD values for five chemicals in the mouse lymphoma assay. The model was selected in Figure 2 and the BMD estimates producing a 10%, 50%, 100% and 200% increase in the background frequency calculated (A, BMD10; B, BMD50; C, BMD100; D, BMD200).The bars represent the calculated 95% confidence interval of each value. The lower and upper limits derived from the BMD estimates were used to differentiate between responses based on non-overlapping confidence intervals.
