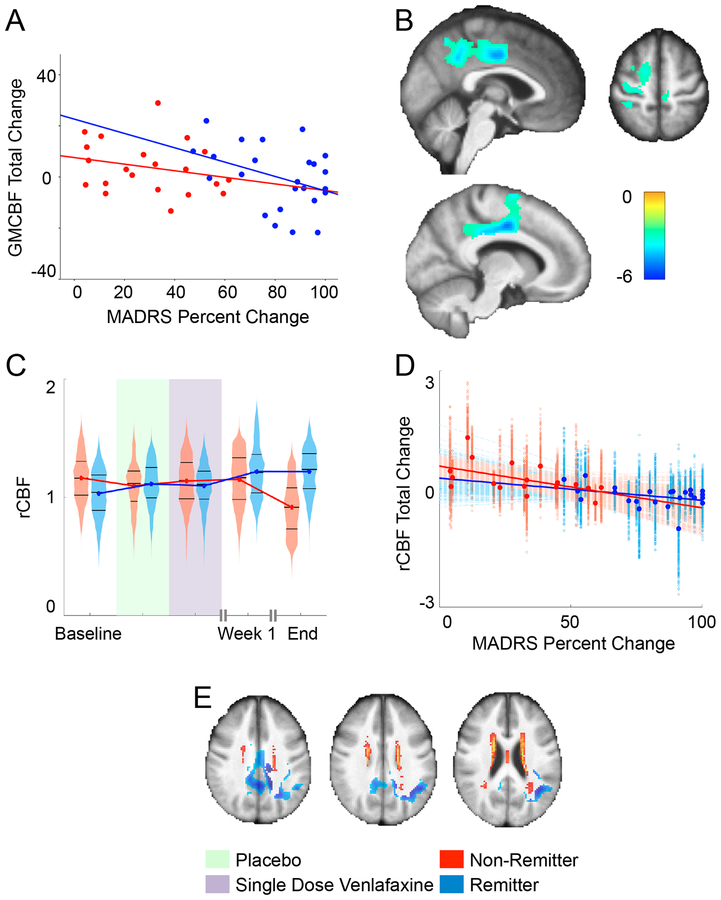
Figure 2.
(A) We calculated the mean CBF within the significant cluster that survived the previous analysis and plotted the trajectories of mean CBF at each time point in remitters and non-remitters. The association between the total change in mean gray matter cerebral blood flow (GMCBF) and the total percent change in MADRS (p=0.03, uncorrected). (B) Cluster that showed significant association between overall CBF difference and overall MADRS percent change, independent of gender and MMSE overlaid on mean structural image (5000 permutations, cluster forming threshold p<0.005, FWE corrected p<0.05). (C) Trajectories of ROI mean regional CBF (rCBF) change in remitters and non-remitters. To better indicate the variability across this cluster, we also used violin plots that show a mirrored histogram alongside the median and 25th and 75th percentiles (black lines). (D) The CBF change from baseline to end of trial was negatively associated with MADRS percent change from baseline to end of trial. To better indicate the variability across this cluster, each voxel-wise point is presented alongside each voxel-wise best-fit line, while the larger highlighted points are the mean CBF and bold best-fit lines are fit to that as well. (E) The significant cluster and WMH probability map overlaid on the mean structural image to demonstrate their spatial relationship.

