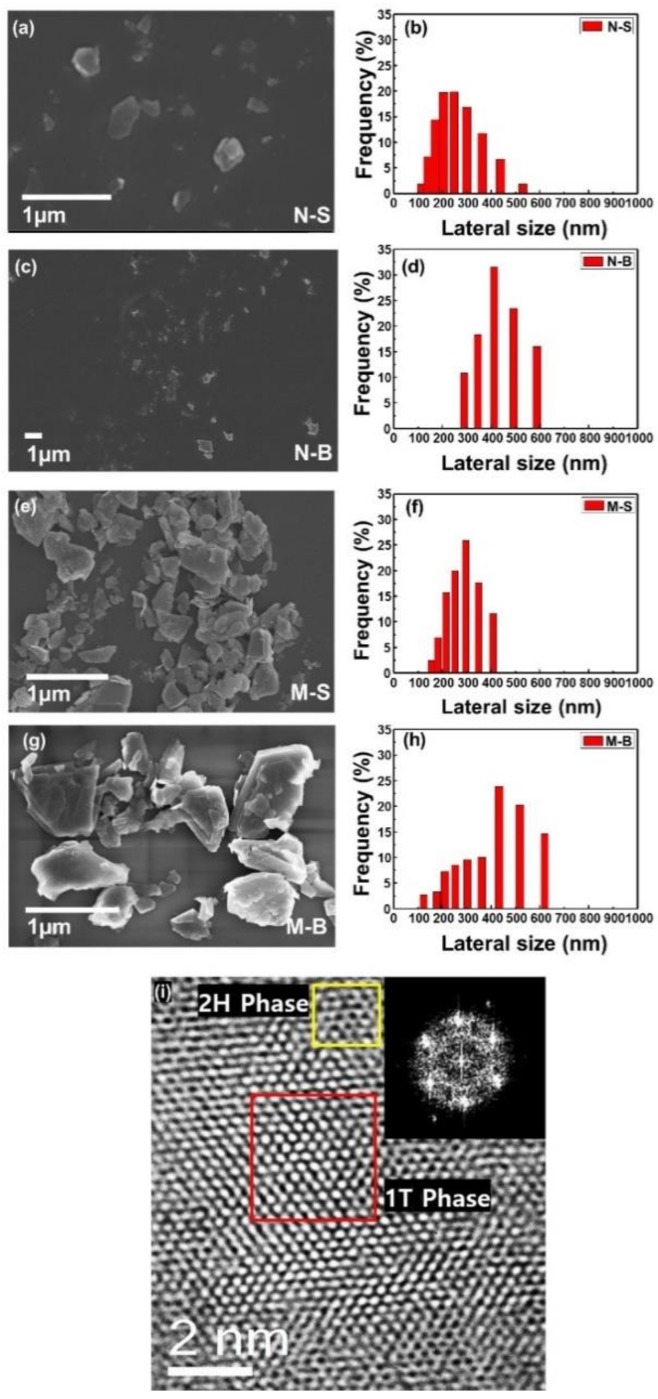
Figure 3.
FE-SEM images and DLS graphs of MoS2 N-S (a,b), N-B (c,d), M-S (e,f), and M-B (g,h). The scale bar indicates 1 µm in all images of FE-SEM. In order to compare the diameter distribution of MoS2, the lateral size and frequency scale were made equal. TEM and electron diffraction images indicate the phase of MoS2 (i).

