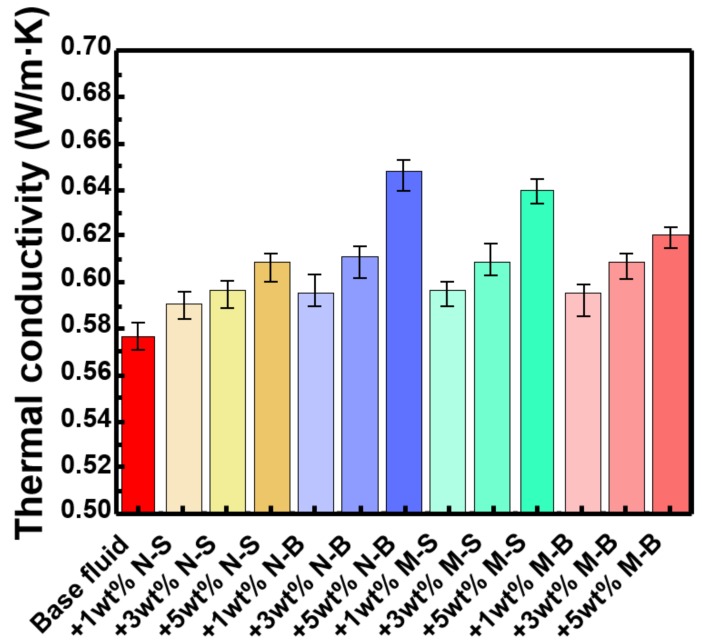
Figure 8.
The thermal conductivity for each WBM. Each sample was measured three times and the average value was shown. As the concentration of MoS2 nanoparticle increases, the thermal conductivity increases linearly. Detailed data and the rate of increase can be found in Table S2.

