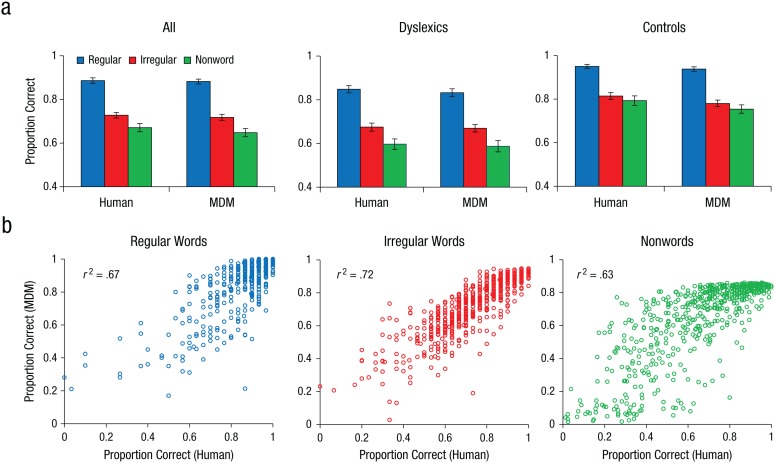
Fig. 2.
Predicted versus actual reading performance. The bar graphs (a) show the proportion of correct responses for regular words, irregular words, and nonwords by the multideficit model (MDM) and humans, separately for all children (N = 622), children with dyslexia (n = 388), and normally developing children (controls; n = 234). Error bars show 95% confidence intervals. The scatterplots (b) show the relationship between predicted and actual individual reading scores for regular words, irregular words, and nonwords for all children.

