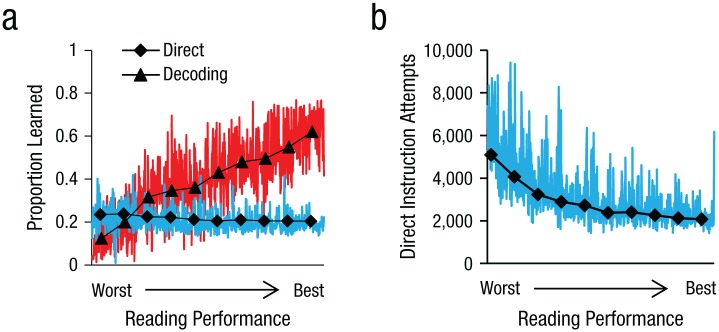
Fig. 3.
The use of decoding versus direct instruction as a function of reading skill. Simulations show (a) the proportion of words that were learned via self-generated decoding and via direct instruction and (b) the number of direct instruction attempts. Both are plotted as a function of the average reading performance of each child. Colored lines represent the individual data, and the black overlaid lines are the results in deciles. The proportions of words in (a) do not add up to 1.0 because they refer to a full-size phonological lexicon, which includes words that were not learned by either decoding or direct instruction for most of the simulated individuals.

