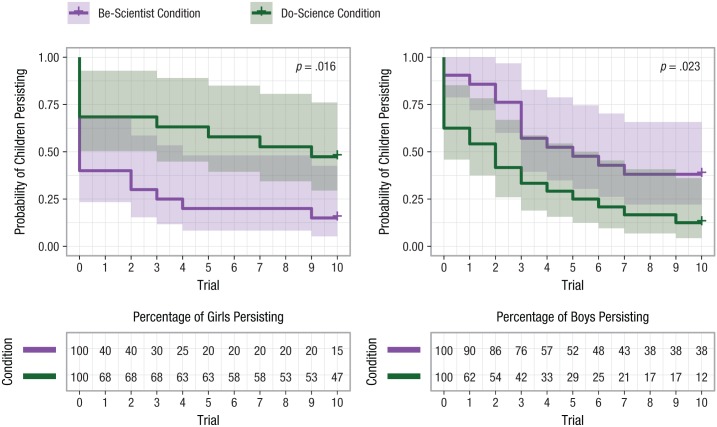
Fig. 1.
Results from Study 1: survival curves for girls (left) and boys (right; top row) and the percentage of girls and boys persisting across trials (bottom row), separately for the be-scientist and do-science conditions. For the survival curves, p values are from log-rank tests. Trial 0 indicates that everyone had the opportunity to play the first trial of the game.

