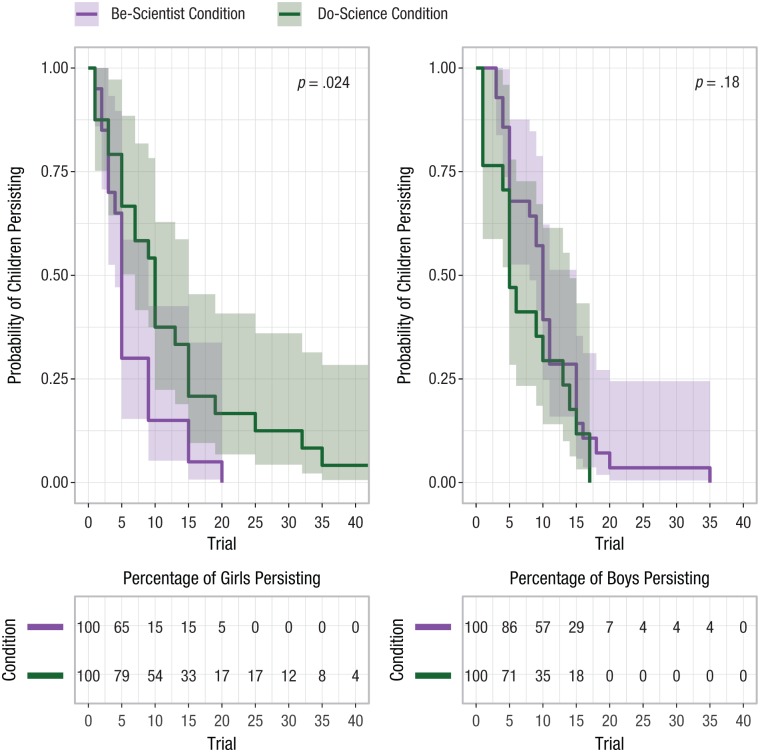
Fig. 2.
Results from Study 2: survival curves for girls (left) and boys (right; top row) and the percentage of girls and boys persisting across trials (bottom row), separately for the be-scientist and do-science conditions. For the survival curves, p values are from log-rank tests. Trial 0 indicates that everyone had the opportunity to play the first trial of the game. Unlike in Study 1, children were allowed to play the game for as long as they wished.

