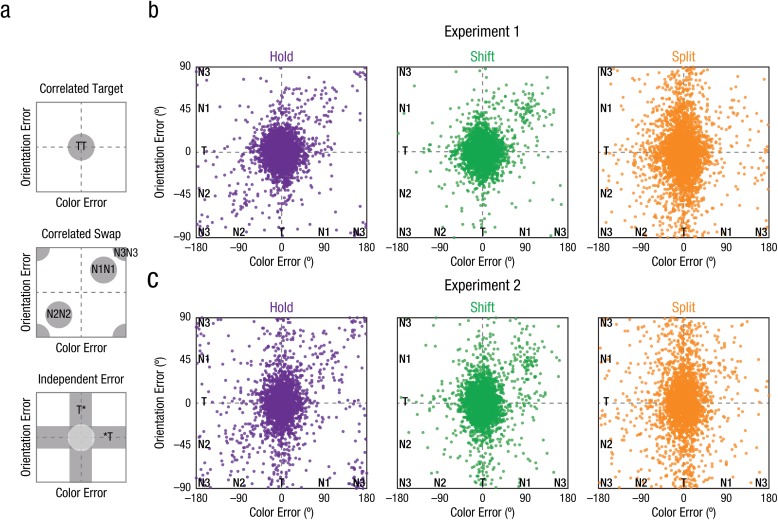
Fig. 2.
Visualizations of color-orientation reports in joint-feature space, plotted as error relative to actual target feature values. Color responses are shown along the x-axis, and orientation responses are shown along the y-axis. For visualization purposes, we have flattened the joint-feature space; both feature dimensions are in fact circular, such that +180° is identical to −180° in color space. The schematics in (a) show predicted distributions for possible response types: Correlated target responses (TT) reflect reporting both features of the target item. Correlated swaps reflect reporting both features of the same nontarget; see the legends in Figure 1 for placement of the critical nontarget (N1), adjacent nontarget (N2), and diagonal nontarget (N3) across different conditions. Independent errors reflect reporting only one target feature (with the missing feature replaced by an asterisk). The scatterplots show trial-by-trial error distributions separately for hold, shift, and split trials, for Experiment 1 (b) and Experiment 2 (c). Each dot represents the corresponding color and orientation response for a single trial, aggregating across participants.

