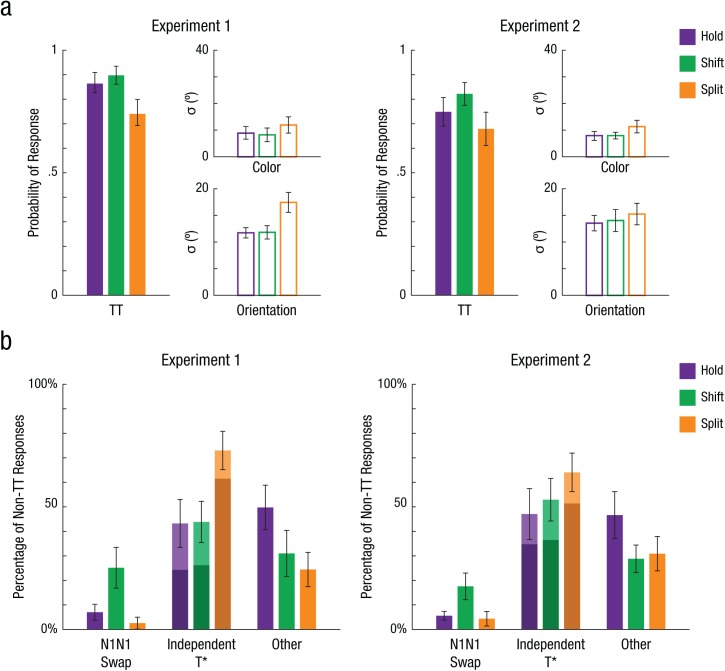
Fig. 3.
Simple joint model maximum-likelihood parameter estimates for both experiments. The graphs in (a) present best-fitting estimates for the probability of a correlated color (C) and orientation (O) target response (TCTO) and the standard deviations of the TCTO distribution for color (σC) and orientation (σO) for each condition. The graphs in (b) present the percentage of erroneous responses (i.e., non-TCTO) that can be attributed to correlated critical nontarget (N1CN1O) swaps, independent target errors (illusory conjunctions in light shading or unbound guesses in darker shading), and other errors (e.g., random guessing) for each condition. The simple model was fitted separately for each participant and each condition, and then parameter estimates were averaged across participants. Error bars represent 95% confidence intervals. Results are shown separately for Experiment 1 (N = 23) and Experiment 2 (N = 25).

