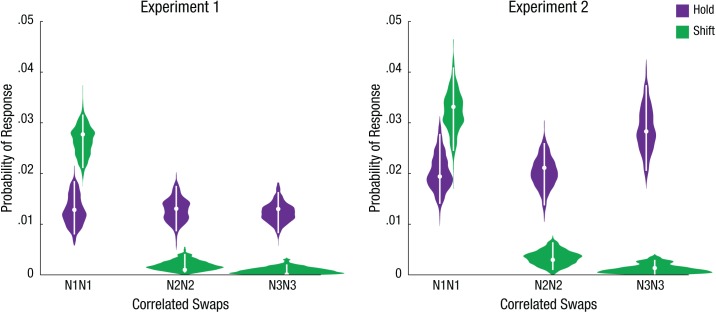
Fig. 4.
Full-joint model maximum-likelihood estimates for both experiments. For each correlated color (C) and orientation (O) swap (N1CN1O, N2CN2O, N3CN3O), a violin plot illustrates the posterior distribution of each parameter over 15,000 postconvergence samples. The white dots mark each parameter’s best-fitting estimate, and the whiskers represent the 95% highest-density interval. The full model was fitted for each condition separately, collapsed across all participants. Results are shown separately for Experiments 1 and 2. N1 = critical nontarget; N2 = adjacent nontarget; N3 = diagonal nontarget.

