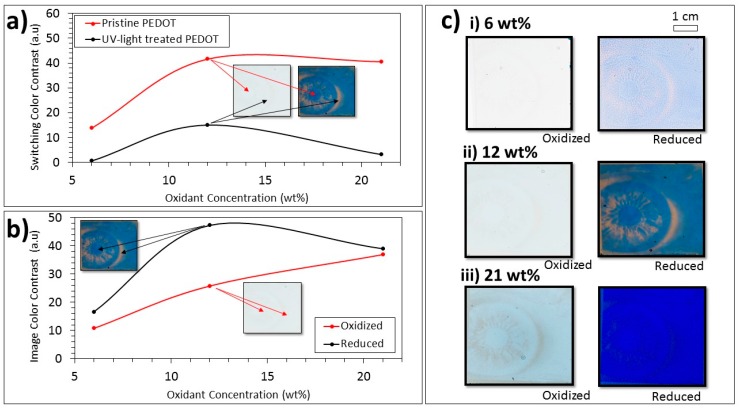
Figure 3.
(a) Switching color contrast values (oxidized vs reduced PEDOT) at different oxidant concentrations comparing pristine and UV-light-treated PEDOT. The arrows and insets illustrate the types of regions that are compared in these graphs (representation only). (b) Image color contrast values (pristine PEDOT versus UV-light-treated PEDOT) at various oxidant concentrations when the films were oxidized and reduced. The arrows and insets illustrate what is compared in the two graphs (representation only). (c) Photographic comparison between the oxidant concentration samples encapsulated using bare ITO for individual electrochromism accompanied by color contrast representations of the switching behavior of the images.

