Fig. 1.

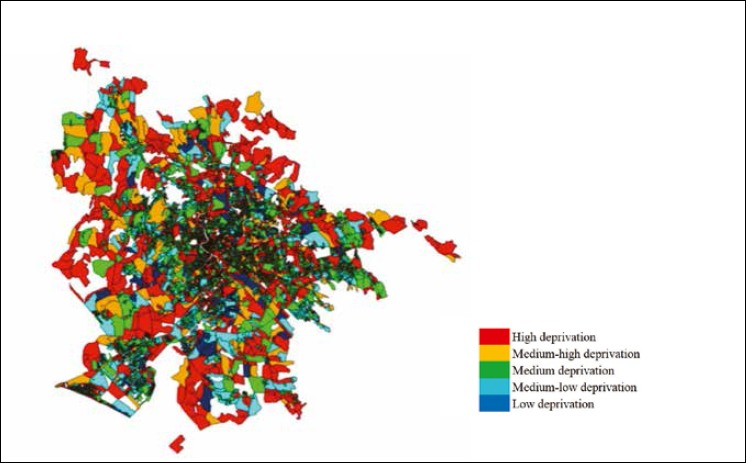
Map of Rome showing the spatial distribution of the deprivation index by census tract. Some census tracts (20.1%), comprising 1.3% of the entire population of Rome, were not analyzed owing to data incompleteness.

Map of Rome showing the spatial distribution of the deprivation index by census tract. Some census tracts (20.1%), comprising 1.3% of the entire population of Rome, were not analyzed owing to data incompleteness.