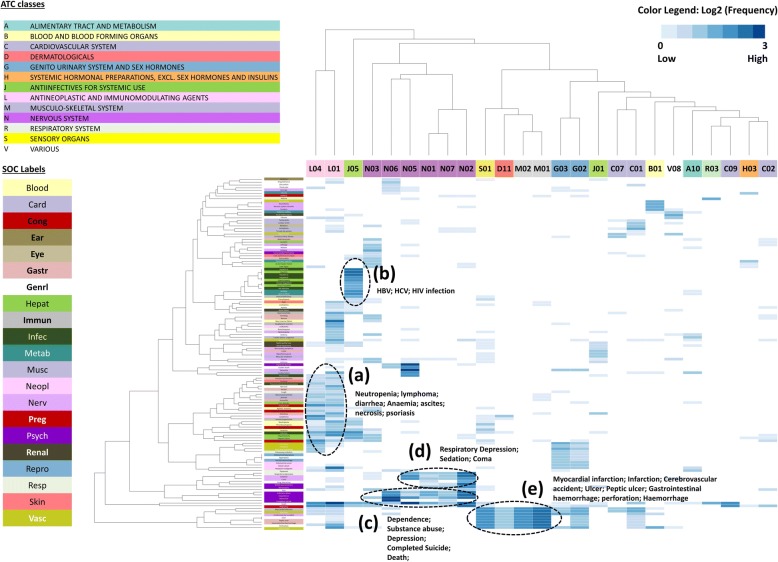
Fig. 3.
Clustering analysis results of drug ATC/MedDRA PT association. Only sADRs in BW section were analyzed. X-axis corresponds to drug ATC groups and Y-axis corresponds to MedDRA PTs. We analyzed MedDRA PTs and ATCs that were found to be associated with at least 5 drugs shown in the analysis. Drug classes and SOCs are represented by different colors. For example, PTs from SOC Hepat are green and can be identified in the Y-axis, whereas drugs from nervous system (N) are purple and can be identified at the X-axis

