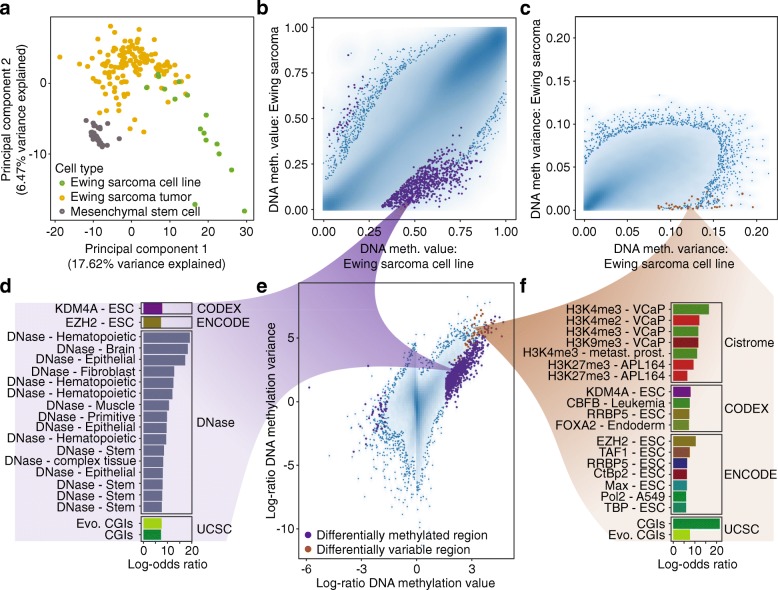
Fig. 4.
Dissection of DNA methylation heterogeneity in Ewing sarcoma samples profiled using RRBS. a Principal component analysis of an RRBS dataset for Ewing sarcoma tumors, cell lines, and mesenchymal stem cells, based on DNA methylation values aggregated across Ensembl Regulatory Build regions. b Density scatterplot comparing the aggregated DNA methylation levels between Ewing sarcoma tumors (N = 140) and Ewing sarcoma cell lines (N = 16). Marked in purple are the most highly ranking differentially methylated regions up to an automatically selected rank cutoff. c Density scatterplot comparing DNA methylation variance between Ewing sarcoma tumors and cell lines. Significant differentially variable regions are marked in brown. d Enrichment (log-odds ratios) based on LOLA analysis for the differentially methylated regions shown in panel b and in panel e. Differently colored bars represent different types of genomic region data. e Density scatterplot comparing the log-ratios between DNA methylation levels and variance in Ewing sarcoma tumors and cell lines. f Enrichment (log-odds ratios) based on LOLA analysis for differentially variable regions shown in panel c and in panel e. ESC, embryonic stem cell; CGIs, CpG islands

