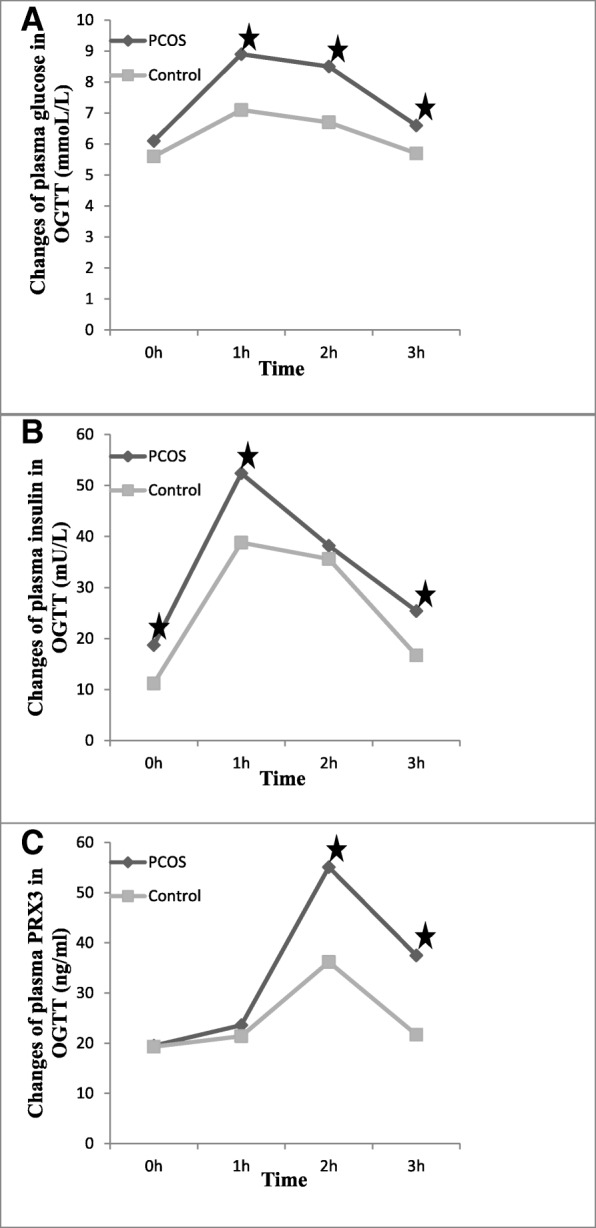
Fig. 1.

Changes of plasma glucose, insulin, and PRX3 in PCOS patients and controls undergoing OGTT. a Plasma glucose reached its peak at 1 h and began to fall back at 2 h. There was significant difference between PCOS patients and controls respectively at 1 h (t = 2.901, P = 0.006), 2 h (t = 2.578, P = 0.034), and 3 h (t = 2.772, P = 0.045). b The change pattern of plasma insulin was as the same as glucose in both PCOS patients and controls. The plasma insulin in PCOS patients was significantly higher than in controls respectively at 0 h (t = 2.833, P = 0.005), 1 h (t = 3.480, P = 0.002), and 3 h (t = 2.321, P = 0.046). c Plasma PRX3 reached its peak at 2 h (one hour later than the insulin peak) and began to fall back at 3 h. There was significant difference between the two groups at 2 h (t = 2.794, P = 0.012 and 3 h (t = 2.568, P = 0.039) respectively
