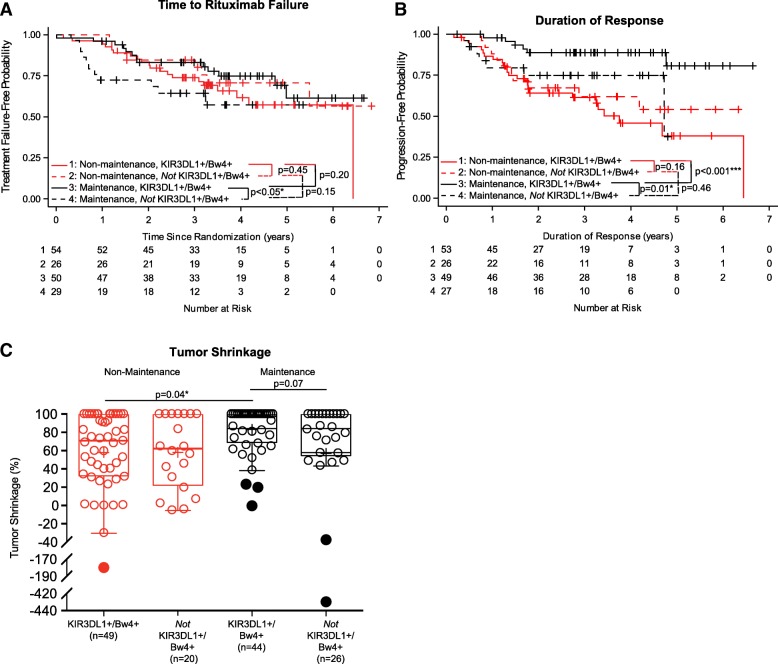
Fig. 2.
Associations of KIR3DL1 and its ligand status with clinical outcomes. Kaplan-Meier curves for TTRF (non-biological events censored) (a) and for duration of response (b) compare those treated with maintenance rituximab and KIR3DL1+/Bw4+ (Line 1: solid-black line), those treated with maintenance rituximab and not KIR3DL1+/Bw4+ (Line 2: dashed-black line), those treated with non-maintenance rituximab and KIR3DL1+/Bw4+ (Line 3: solid-red line) and those treated with non-maintenance rituximab and not KIR3DL1+/Bw4+ (Line 4: dashed-red line). c displays box-plots for percent tumor shrinkage for the four groups above (p-value not shown if p > 0.1). Outlying values are shown as filled circles outside the horizontal lines. (“*” indicates p < 0.05; “***” indicates p < 0.001)

