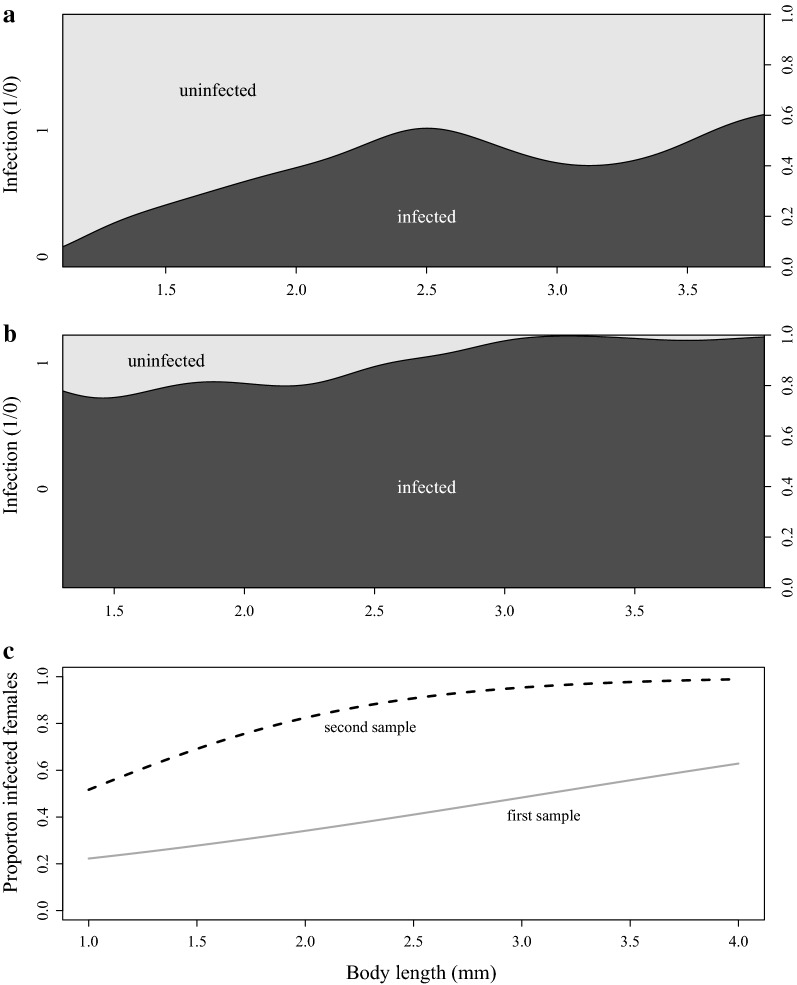
Fig. 2.
Density plot for infection (dark shading) by the end of the observation period, by body length at capture for the first (a) and the second sample (b), and the predicted relationship between body length at capture and infection levels fitted with a quasibinomial model (c). Solid and dashed lines represent the first and the second sample, respectively. Body size at maturity was on average 2.6 mm in both samples

