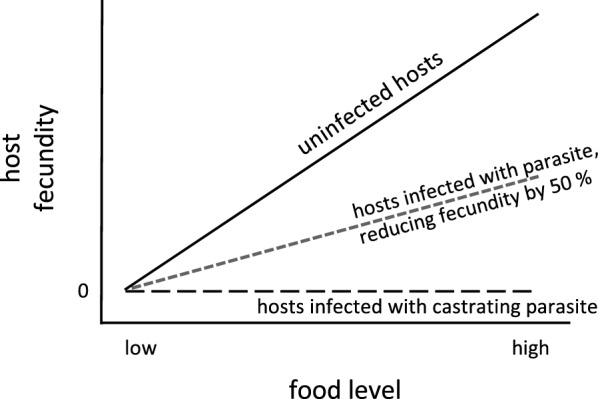
Fig. 5.

Schematic relationship between host fecundity and food level for infected and uninfected females. Fecundity increases with greater food levels. This is also seen for females infected with non-castrating parasites (here shown for a parasite reducing fecundity by 50%), but not for females infected with castrating parasites
