
Figure 1.
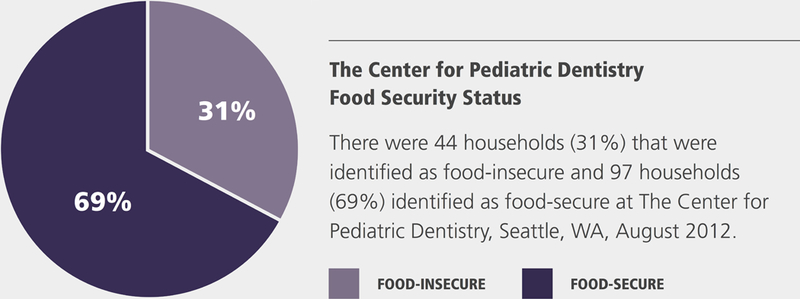
Food security status of 141 households surveyed in the waiting area of the Center for Pediatric Dentistry in August of 2012 is depicted in the pie chart of Figure 1. Food-secure households are depicted in dark purple, while food-insecure households are depicted in lavender. A household was identified as food-insecure if the parent or guardian completing the survey gave two or more affirmative responses on the 6-item short form of the Household Food Security Scale.