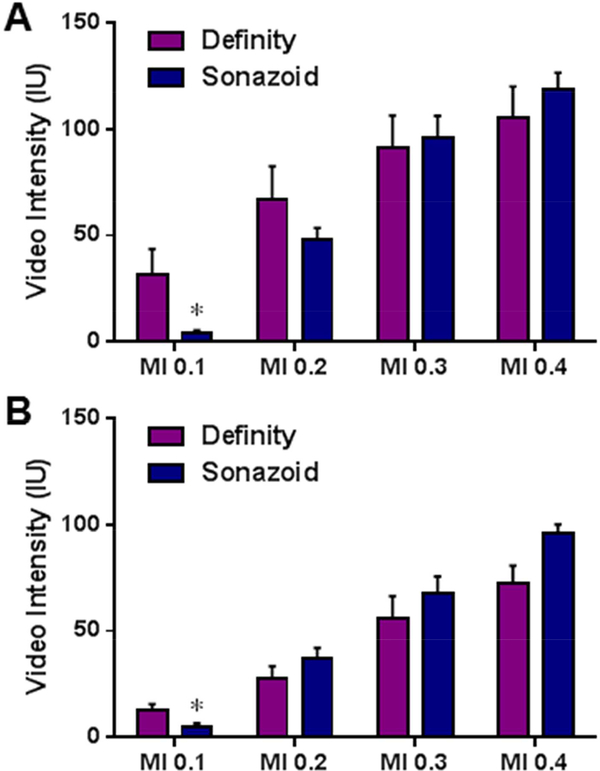
Figure 6.
Mean (±SEM) video intensity values obtained at the longest pulsing interval (10 s) for each mechanical index (MI) during (A) high-frequency CEU in the murine hindlimb, and (B) low-frequency CEU imaging in the canine hindlimb. *p<0.05 versus Definity. For both agents, test for linear trends for an increase in intensity with MI were p<0.01 for the murine model and p=0.01 for the canine model.

