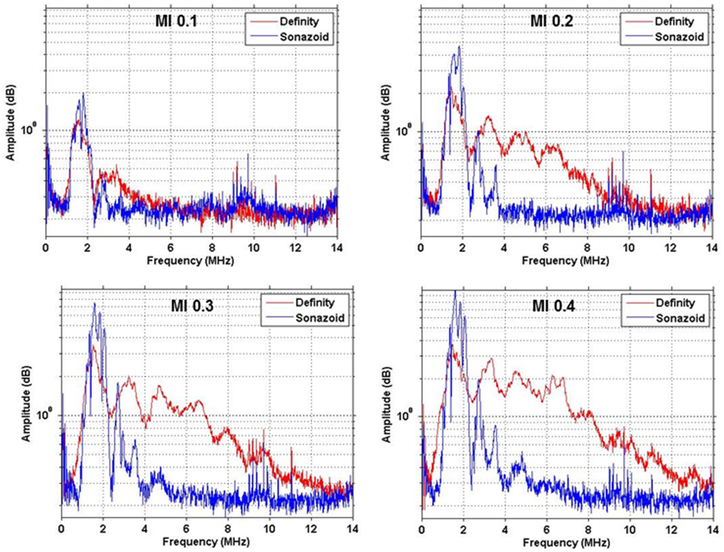
Figure 7.
Amplitude-frequency histograms for Definity (red) and Sonazoid (blue) obtained during ultrasound imaging at 1.8 MHz illustrating greater degree of broad-band signal (inertial cavitation) for Definity at MI 0.2 and greater. Harmonic peaks, illustrating stable cavitation, are seen for both agents at all powers.

