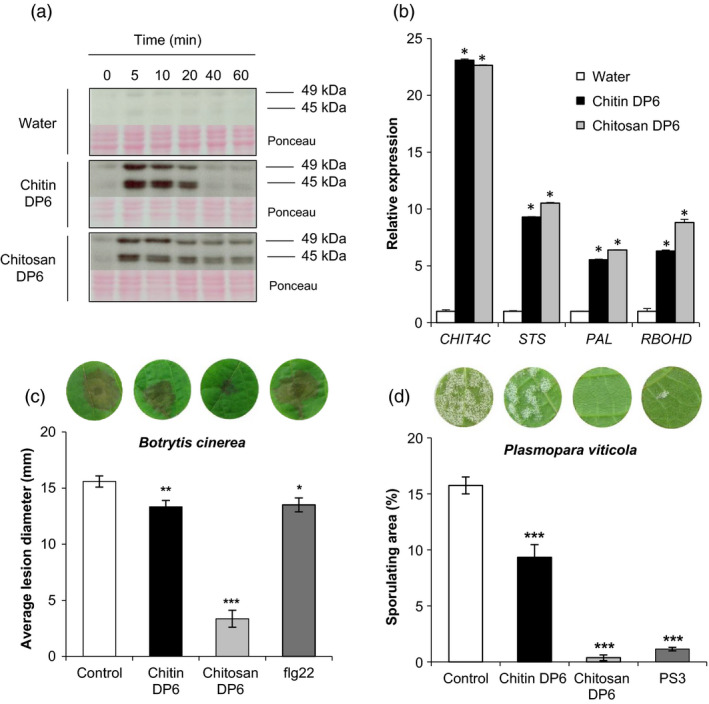
Figure 1.

Chitin and chitosan induced defense responses and resistance to pathogens in grapevine. (a) Activation kinetics of two mitogen‐activated protein kinases (MAPKs) detected by immunoblotting with an antibody raised against the human phosphorylated extracellular regulated protein kinase 1/2 (α‐pERK1/2) in grapevine cells treated with chitin DP6 (100 μg/mL), chitosan DP6 (100 μg/mL) or water (negative control). Homogeneous loading was checked by Ponceau red staining. (b) Expression of defense genes encoding an acidic chitinase (Chit4C), a stilbene synthase ( STS ), a phenylalanine ammonia lyase ( PAL ) and a respiratory burst oxidase homolog D (RbohD) measured by quantitative polymerase chain reaction (qPCR) 1 h post‐treatment with chitin DP6 (100 μg/mL), chitosan DP6 (100 μg/mL) or water. Values represent the mean of triplicate data ±SE (n = 3) from one experiment out of three and data were normalized by the housekeeping gene EF1α and compared with water (negative control), set as 1. Asterisks (*) indicate statistically significant differences between water and chitooligosaccharide treatment, using an unpaired heteroscedastic Student's t test (P < 0.05). (c) Development of B. cinerea at 3 days post‐inoculation (dpi) on grapevine leaf discs treated 48 h before with chitin DP6 (1 mg/mL), chitosan DP6 (1 mg/mL) or flg22 (10 μm) previously solubilized in Dehscofix 0.1% and compared with control (adjuvant : Dehscofix 0.1%). Values represent the mean of lesion diameters ±SE (n ≥ 36 discs from three different plants) from one representative experiment out of three. (d) Sporulation caused by P. viticola at 8 dpi on grapevine leaf discs treated 48 h before inoculation with chitin DP6 (100 μg/mL), chitosan DP6 (100 μg/mL) or 2.5 mg/mL sulphated laminarin (PS3) previously solubilized in Dehscofix 0.1% and compared with control (adjuvant : Dehscofix 0.1%). Sporulating leaf area was evaluated by image analysis Visilog 6.9 software (Kim Khiook et al., 2013). Values represent the mean of percentage of sporulating area ±SE (n = 30 discs from three different plants) from one representative experiment out of three. Asterisks indicate a statistically significant difference between control and the elicitor treatment (Student's t‐test; *, P < 0.05, **, P < 0.01, ***, P < 0.001). A representative leaf disc for each treatment is shown. Similar results were obtained in at least three independent experiments.
