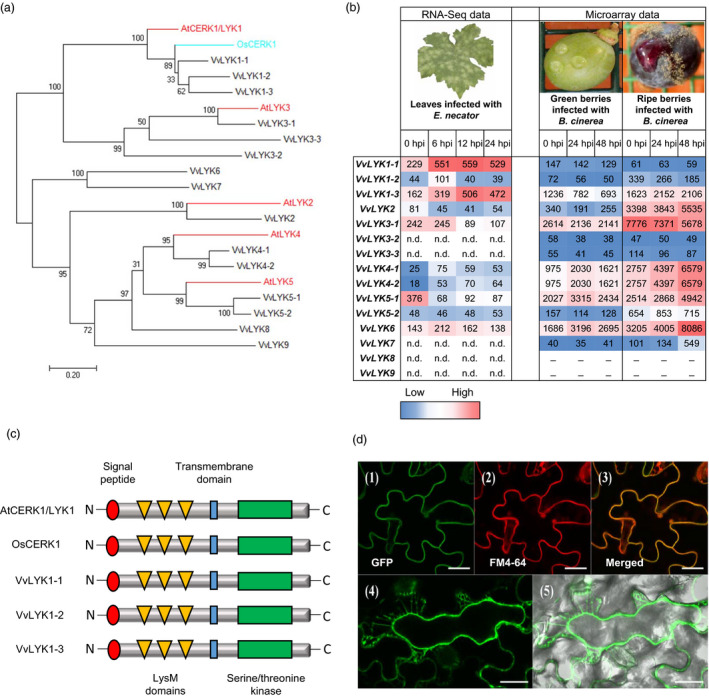
Figure 2.

Phylogenetic analysis and characterization of grapevine LysM‐RKs (VvLYKs). (a) Maximum‐likelihood phylogenetic tree drawn with MEGA 7 (Kumar et al., 2016) showing the relationship between the Arabidopsis proteins AtCERK1/LYK1 and AtLYK2‐5 (red), the rice OsCERK1 (blue) and the most similar protein sequences of Vitis vinifera (black). Sequences used for the phylogenetic analysis were: AtCERK1/LYK1 (NP_566689), AtLYK2 (OAP05017), AtLYK3 (NP_175606), AtLYK4 (NP_179957), AtLYK5 (NP_180916), OsCERK1 (A0A0P0XII1), VvLYK1‐1 (XP_010657225), VvLYK1‐2 (XP_010655366), VvLYK1‐3 (XP_010655365), VvLYK2 (XP_019080819), VvLYK3‐1 (XP_002283628), VvLYK3‐2 (XP_019074828), VvLYK3‐3 (XP_002272814), VvLYK4‐1 (XP_002269408), VvLYK4‐2 (XP_010649202), VvLYK5‐1 (XP_002277331), VvLYK5‐2 (MF177034), VvLYK6 (XP_002280070), VvLYK7 (XP_002269472), VvLYK8 (XP_002281880) and VvLYK9 (XP_002276830). (b) VvLYK expression profiles during E. necator or B. cinerea infection. Results are expressed as Relative Expression Values. Colour range has been made independently from RNA‐Seq or microarray data. (n.d. = no full length transcript detected in RNA Seq; _ = no specific probe available in microarray). (c) Schematic structure of AtCERK1/LYK1, OsCERK1, VvLYK1‐1, VvLYK1‐2 and VvLYK1‐3 based on the multiple alignment realized with T‐coffee (Figure S2). (d) Subcellular localization of VvLYK1‐1‐GFP in the line Atcerk1/p35S::VvLYK1‐1‐GFP . Leaves of Arabidopsis thaliana expressing VvLYK1‐1‐GFP were incubated with the plasma membrane dye FM4‐64. Confocal microscopy imaging revealed the green GFP‐tagged VvLYK1‐1 (1), the red FM4‐64 labelled plasma membrane (2) and the co‐localization of both probes in Arabidopsis leaves (3). (4) NaCl (1M) induced plasmolysis and confocal microscopy imaging revealed that VvLYK1‐1‐GFP fluorescence followed the plasma membrane shrinking (5). Bars, 20 μm.
