
Figure 4.
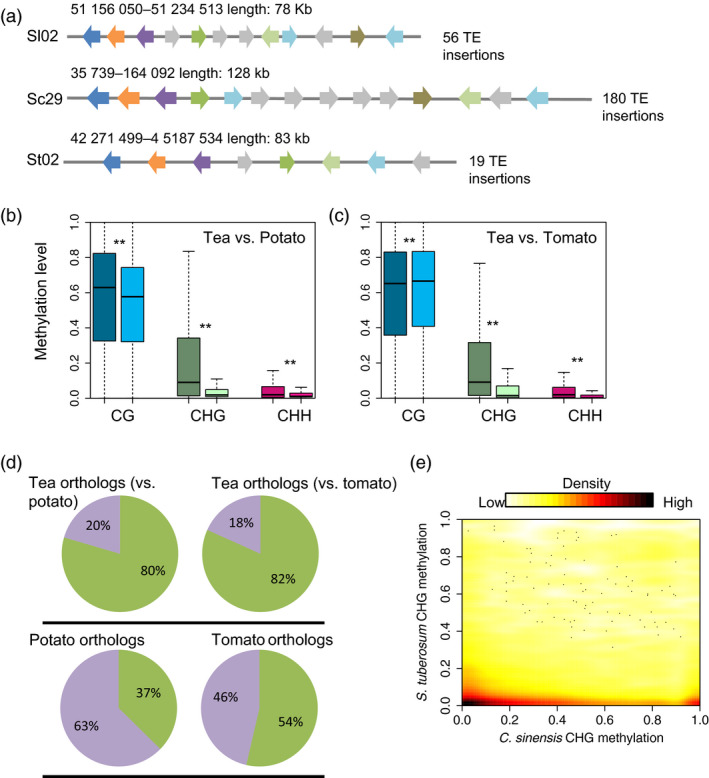
Comparisons of orthologous gene pairs in tea, potato and tomato. (a) A comparison of collinear regions of tea, tomato and potato. Orthologous gene pairs are indicated by the same colours, and the grey colour indicates non‐homologues genes. DNA methylation comparisons of orthologous gene pairs between tea and potato (b), and tea and tomato (c) are shown for all three sequence contexts. Double stars indicate Mann–Whitney test P‐value <0.001. Dark colours indicate the CG (blue), CHG (green) and CHH (red) sequence contexts in tea, and light colours indicate the same in potato and tomato. (d) Pie charts illustrating the percentage of TE‐associated (green) and non‐TE associated (purple) orthologous genes in tea and potato, tea and tomato, and their orthologous copies in potato and tomato, respectively. TE‐associated genes are defined as genes that overlap with TEs. (e) Distribution of CHG methylation levels of 20 990 orthologous gene pairs between tea and potato.