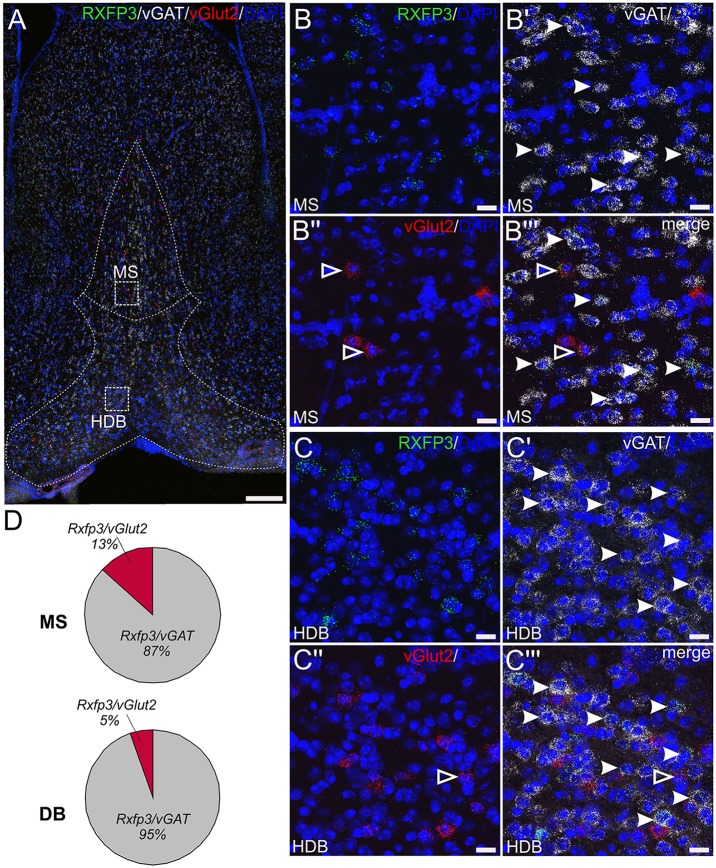
Figure 3.
Detection of Rxfp3 mRNA and co-expression with vGAT and vGlut2 mRNA in the MS/DB of adult mice. (A) Distribution of neurons expressing Rxfp3 (green), vGAT (white) and vGlut2 (red) mRNA at 0.74 mm from bregma (40× images represented as a maximum projection, 0.8 μm intervals). Dotted lines were drawn and superimposed on the maximum intensity projection from the corresponding mouse brain atlas section. Sections were counterstained with DAPI (blue) to indicate cell nuclei. (B,C) High magnification images (40× images represented as maximum projection, 0.3 μm intervals) of the boxed areas in (A) illustrating the co-localization of Rxfp3 (B,C), vGAT (B′,C′), vGlut2 (B″,C″) mRNA and the merged channels (B″′,C″′) in the MS and horizontal DB. Examples of neurons co-expressing Rxfp3 and vGAT mRNA (solid arrowheads) and Rxfp3 and vGlut2 mRNA (open arrowheads) are indicated. (D) Percentage of co-localization of Rxfp3 mRNA and vGAT and vGlut2 mRNA, respectively within the MS and DB. Scale bars 200 μm (A) and 20 μm (B,C).

