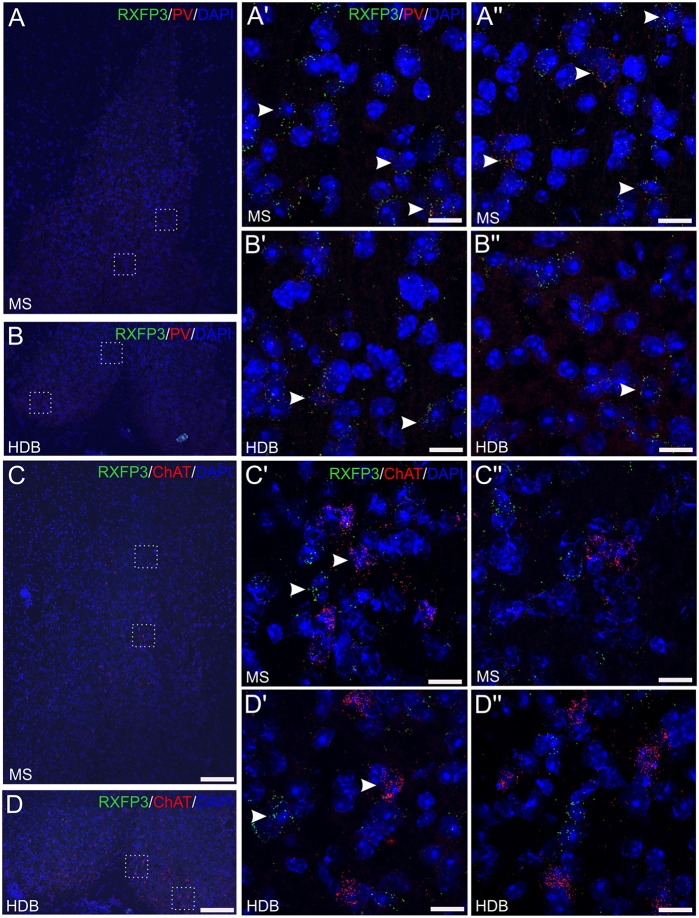
Figure 4.
Detection of Rxfp3 mRNA and co-expression with parvalbumin (PV) mRNA, but not ChAT mRNA, in the MS/DB of adult mice. (A,B) Detection of Rxfp3 and PV mRNA in the MS (A,A″) and horizontal DB (B,B″). Low-magnification images of the MS/DB area (left) and high-magnification images (63× images represented as maximum projections, 0.3 μm intervals) of the boxed areas in (A,B; right), illustrate the presence of Rxfp3 (green) and PV (red) mRNA, in both distinct neurons and the same neurons, consistent with RXFP3 expression by a population of PV-positive GABA neurons. Sections were counterstained with DAPI (blue) to indicate cell nuclei. Arrowheads indicate Rxfp3 mRNA in PV mRNA-positive neurons in the different fields. (C,D) Detection of Rxfp3 and ChAT mRNA in the MS (C,C″) and horizontal DB (D,D″). Low-magnification overview images (left) and high-magnification images of the boxed areas in (C,D; right) illustrate the presence of strong Rxfp3 (green) and ChAT mRNA (red) expression in multiple neurons (arrowheads), but provide no evidence of co-expression of Rxfp3 (green) and ChAT mRNA in either MS or DB. Sections were counterstained with DAPI to indicate cell nuclei (blue). Scale bars 200 μm (A–D) and 20 μm (A′–D″).

