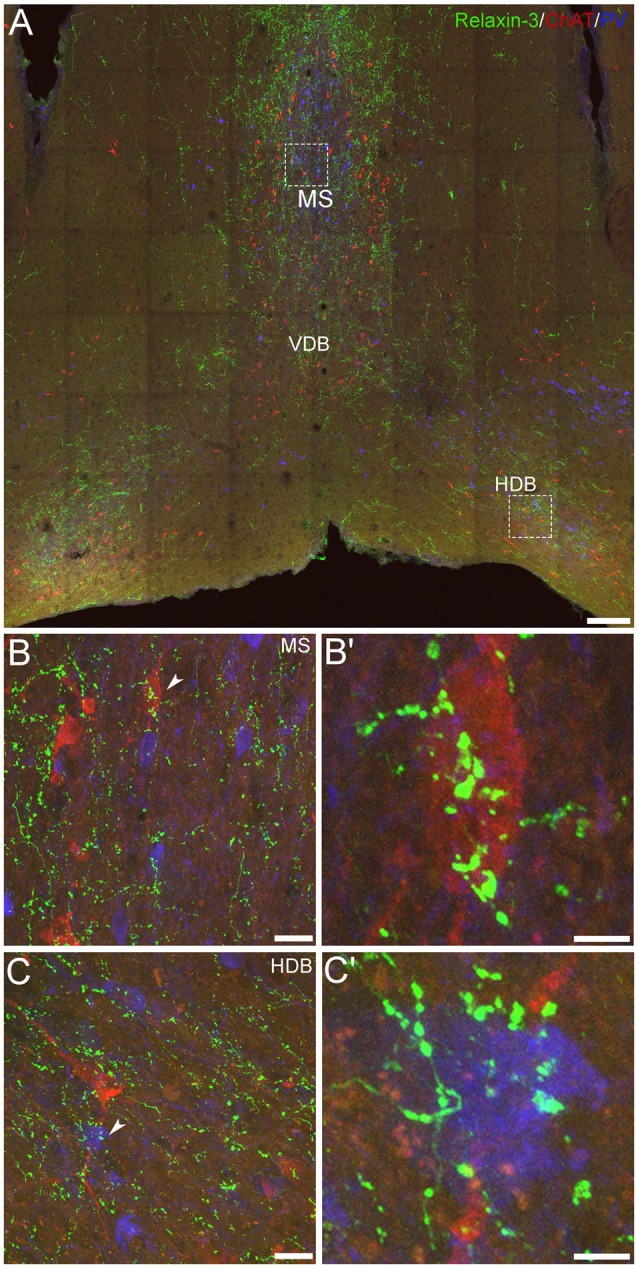
Figure 5.

Comparative distribution of relaxin-3-immunoreactive nerve fibers and neurons positive for GABAergic and cholinergic markers in the MS/DB of adult mice. (A) A mosaic digital image (20× images represented as z-stack maximum projections, 1 μm intervals) of mouse MS/DB at 0.74 mm from bregma, illustrating relaxin-3 (green), ChAT (red) and PV (blue) immunoreactivity. (B,C) High-resolution images (63×, z-stack maximum projections, 0.1 μm intervals) of the boxed areas in (A), illustrate the potential close association of relaxin-3 elements with a ChAT-immunoreactive neuron in MS (B,B′) and a PV-immunoreactive neuron in horizontal DB (C,C′). Scale bars 200 μm (A), 20 μm (B,C) and 5 μm (B′,C′).
