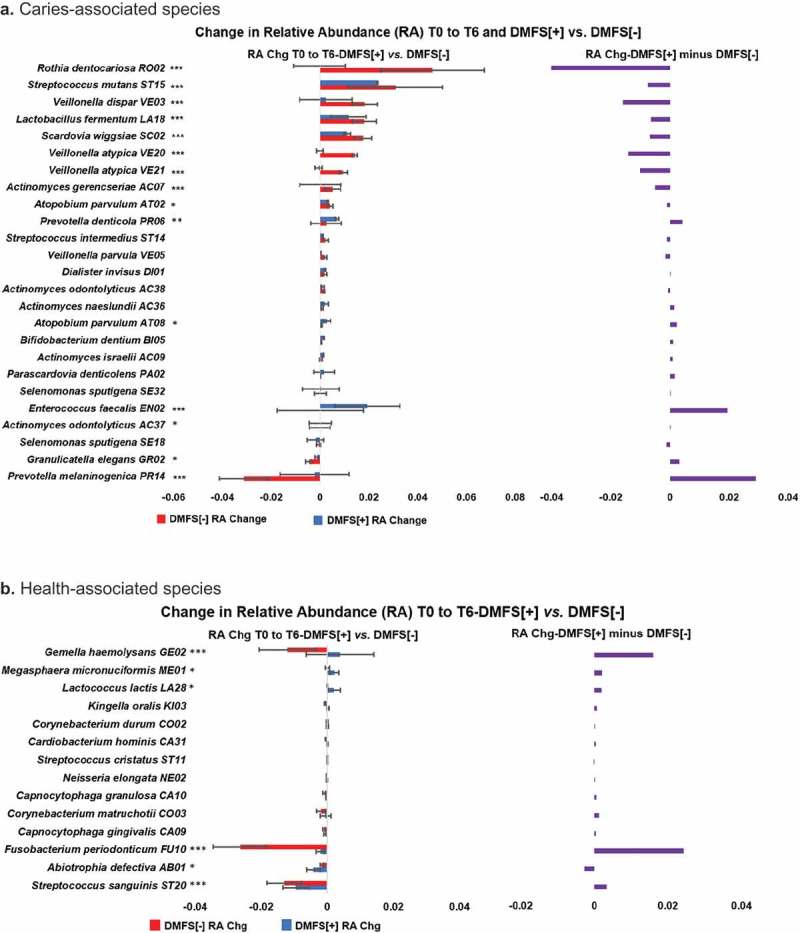
Figure 4.

Changes in relative abundance of caries- and health- associated species in DMFS[+] compared to DMFS[-] RT-treated HNC patients (Subset-D, all patients with CC). a. Caries-associated species. b. Health-associated species On the left of each chart, the T0 to T6 relative abundance (RA) change (Chg), i.e., T6 average RA minus T0 average RA by species is shown for the DMFS[+] and DMFS[-] groups of Subset-D, all HNC patients treated with RT and concurrent chemotherapy, for caries- (a) and health- (b) associated species. The difference in the group RA’s shown on the left, i.e., DMFS[+] average RA minus DMFS[-] average RA, by species is presented on the right of the charts. HOMINGS species probes identification 4-character codes are shown. A chi-squared test was used to determine the significance of differences in RA increases/decreases between the DMFS[+] and DMFS[-] groups. *p < 0.05; **p < 0.01; ***p < 0.001.
