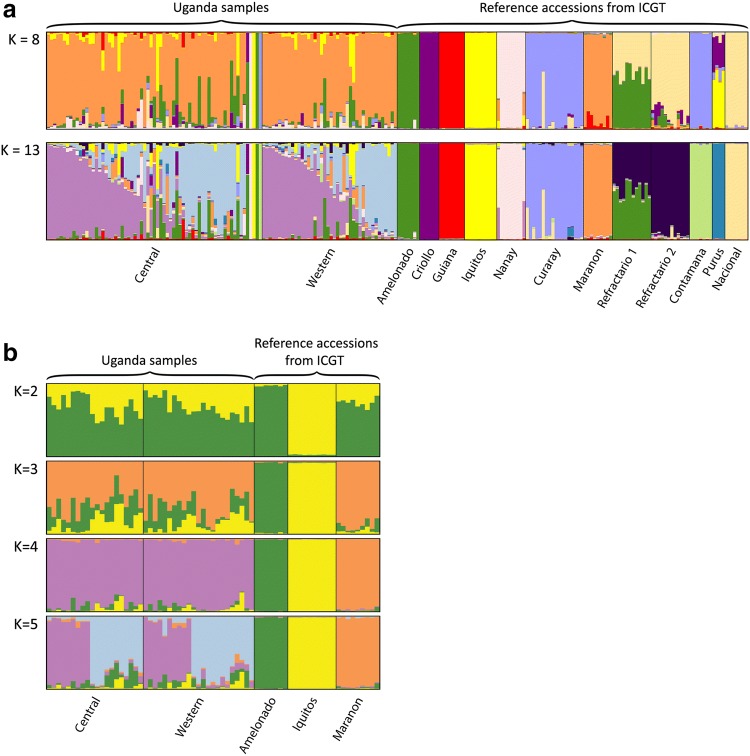
Fig. 5.
Structure analysis of Ugandan cacao (Theobroma cacao L.) samples. Population structure was determined using Structure v2.3.4 and based on 87 SNP markers. Each vertical line represents an individual; a 109 Ugandan samples and 109 cacao (Theobroma cacao L.) reference accessions from the International Cocoa Genebank, Trinidad representing the different genetic groups described by Motamayor et al. (2008) and Motilal et al. (2013); b samples with more than 80% membership to undefined clusters 1 and 2 and the Amelonado, Iquitos and Marañon reference accessions

