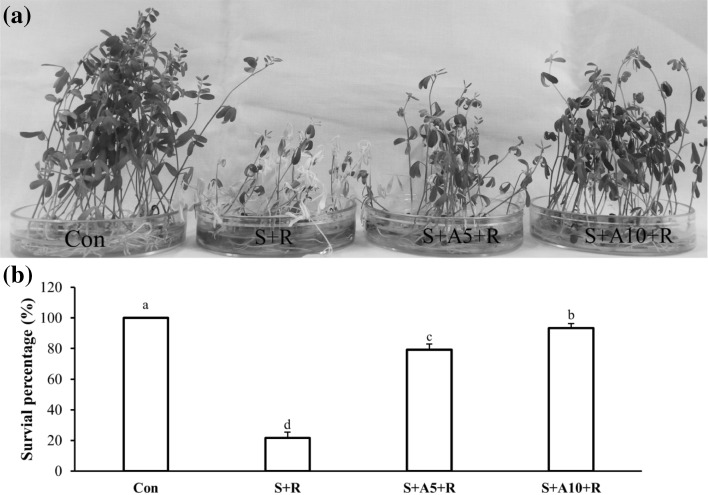
Fig. 1.
Phenotypic appearance of lentil seedlings under salt stress treated with or without Na-acetate in experiment I (a), survival percentage 6-day after recovery (b). The treatments were Control (Con), 100 mM NaCl (S+R), 100 mM NaCl+5 mM Na-acetate (S+A5+R), 100 mM NaCl+10 mM Na-acetate (S+A10+R). Mean (± SD) were calculated from three replicates for each treatment. Values with different letters are significantly different at P ≤ 0.05 applying Fisher’s LSD test

