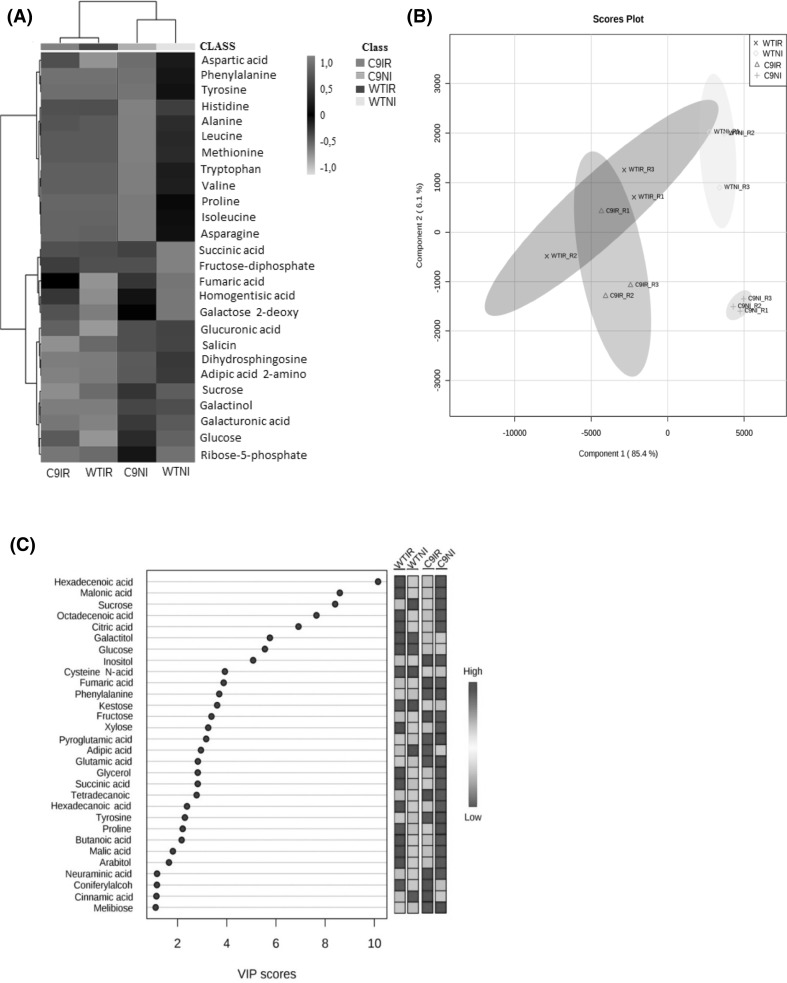
Fig. 3.
Analysis of the metabolic profiles of the C9 and WT genotypes under irrigated (IR) and non-irrigated (NI) conditions. a Heat map showing the differences in the abundance of the metabolites in response to drought in soybean leaves. b Principal component analysis (PCA) of all the metabolites identified. c Major metabolites responsible for discrimination between irrigated and non-irrigated soybean groups identified by VIP score

