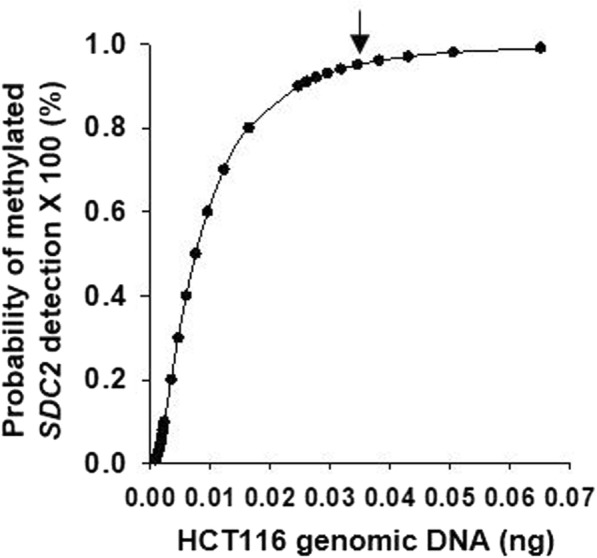
Fig. 2.

LoD of SDC2 methylation test using data derived from Table 2. The LoD of the test using simulated stool DNA samples was determined by Probit analysis. The y-axis plots the probability of methylated SDC2 detection while the x-axis plots spiked HCT116 genomic DNA in a total of 2.0 μg of SDC2 methylation-negative stool genomic DNA. The estimated LoD (34.5 pg) is indicated by an arrow
