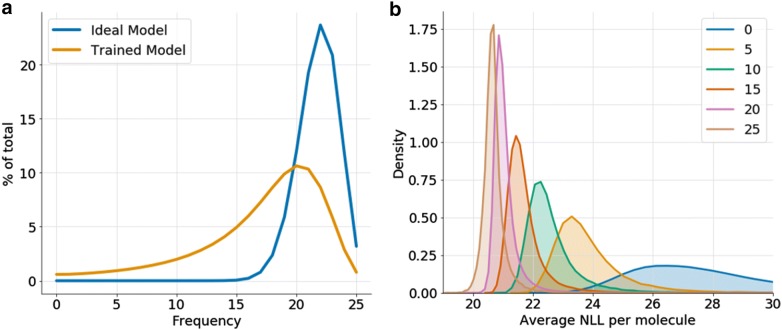
Fig. 5.
a Histograms of the frequency of the RNN models (orange) and the theoretical (binomial) frequency distribution of the ideal model (blue). b Histograms of the average NLL per molecule (from the 25 models) for molecules with frequency 0, 5, 10, 15, 20 and 25 computed from a sample of 5 million molecules from GDB-13

