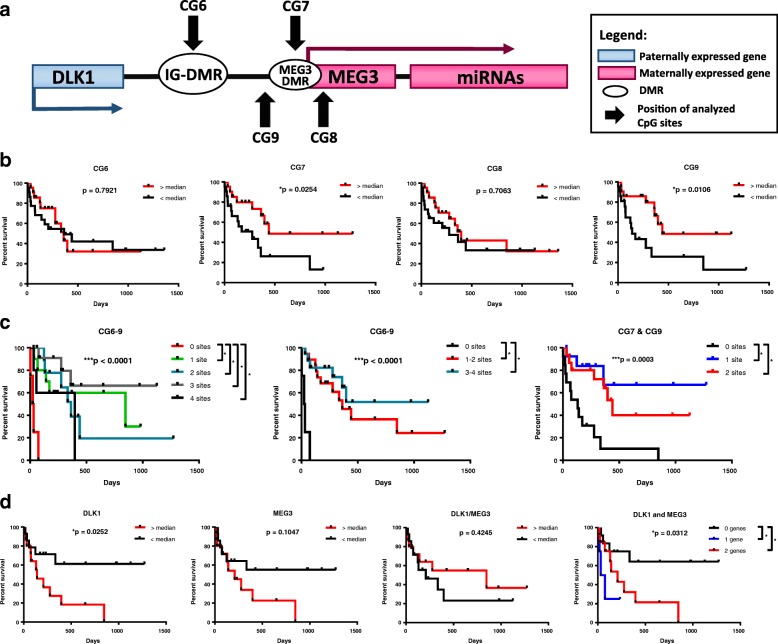
Fig. 1.
Survival of AML patients based on DLK1-MEG3 CpG site methylation and imprinted gene expression in AML MNCs. a Schematic representation of the human imprinted DLK1-MEG3 locus. b Analysis of AML patients’ survival depending on median methylation values for particular CpG site amplicons using the Mantel-Cox test. *p < 0.05. Sample counts for “< median”: CG6 n = 21, CG7 n = 20, CG8 n = 22, and CG9 n = 20; and for “> median”: CG6 n = 22, CG7 n = 21, CG8 n = 23, and CG9 n = 21. c Analysis of AML patients’ survival depending on pooled CG6–CG9 or CG7 and CG9 amplicon median methylation values using the Mantel-Cox test. Lines represent the number of CpG site amplicons out of 4 (CG6–9) or 2 (CG7 and CG9) analyzed which exhibited increased methylation relative to their respective median values. ***p < 0.001 and Bonferroni post hoc analysis *p < 0.05. Sample counts for CG6–9 (0–4 sites): 0 site n = 3, 1 site n = 10, 2 sites n = 9, 3 sites n = 13, and 4 sites n = 5; for CG6–9 (0, 1–2, 3–4 sites): 0 site n = 3, 1–2 sites n = 19, 3–4 sites n = 18; and for CG7 and 9: 0 site n = 12, 1 site n = 14, and 2 sites n = 15. d Mantel-Cox analysis of AML patients’ survival depending on median DLK1, MEG3, and DLK1/MEG3 and pooled DLK1 and MEG3 expression ratio values obtained by RT-qPCR. Red lines represent patients with increased expression of DLK1 and MEG3 and an increased DLK1/MEG3 ratio. For pooled expression results, the Bonferroni post hoc analysis was used and lines represent the number of genes which exhibited increased expression relative to their respective median values. *p < 0.05. Sample counts for “> median” expression: DLK1, MEG3, and DLK1/MEG3 n = 14; and for “<median” expression: DLK1, MEG3, and DLK1/MEG3 n = 15

